
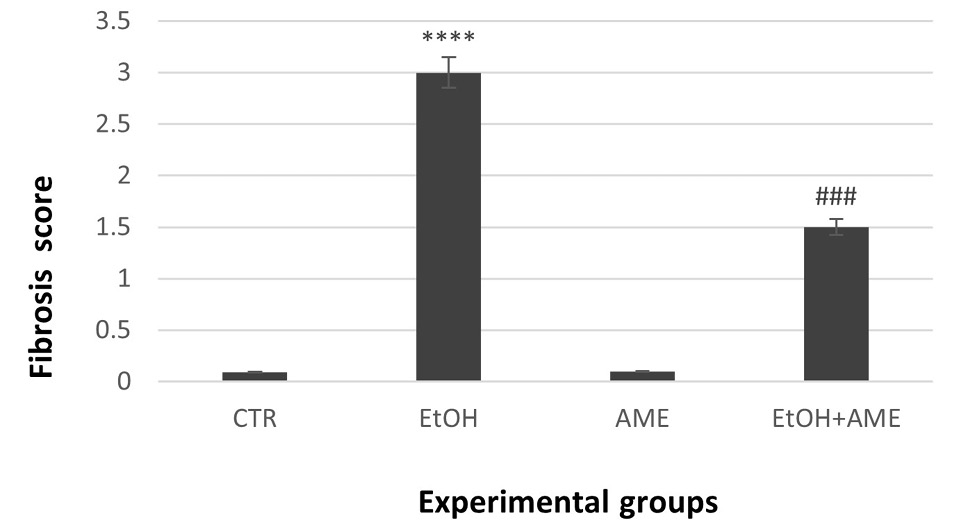
Fig. 4.
Semiquantitative estimation of renal fibrosis scores in the experimental groups. All values are expressed as the mean ± standard error (SE). CTR, control; EtOH, 40% ethanol (3 g kg-1); AME, aqueous myrrh extract (500 mg kg-1); and EtOH + AME, 40% ethanol followed by aqueous myrrh extract. *p > 0.05 and ****p > 0.0001 vs. CTR; ###p > 0.001 vs. EtOH.