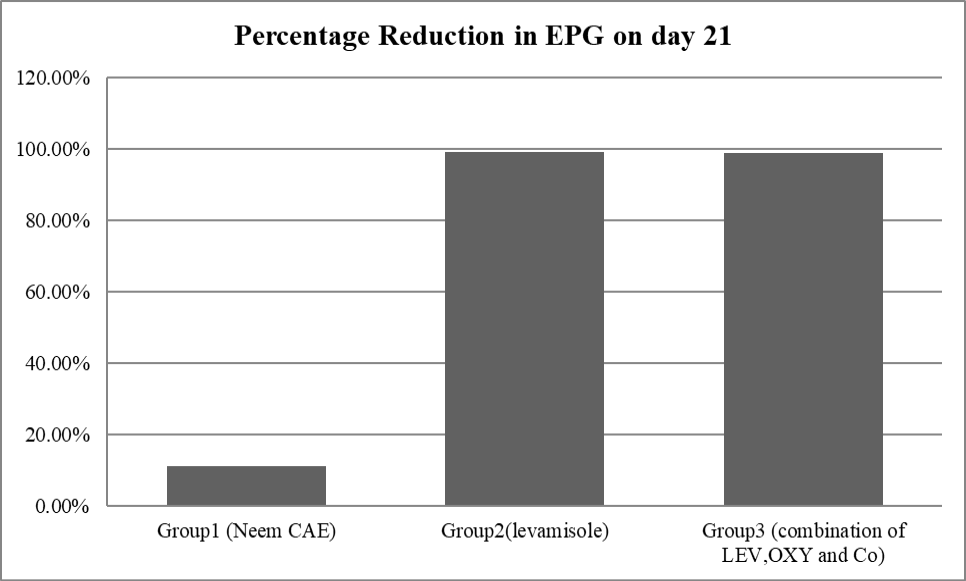
Figure 1:
Graph showing decrease in faecal egg count of treated groups at day 21 post treatment comparatively by various groups.
Graph showing decrease in faecal egg count of treated groups at day 21 post treatment comparatively by various groups.