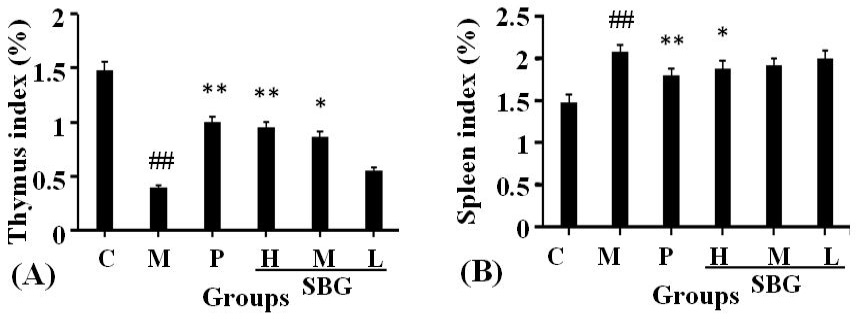
Fig. 1.
Effect of SBG on thymus index (A) and spleen index (B) of rats.
Notes: C, control group; M, model group; P, positive drug group; SBG-H, SBG high-dose group; SBG-M, SBG medium-dose group; SBG-L, SBG low-dose group; n = 10, ̅x±s. Compared with control, ## P <0.01; Compared with model, * P <0.05, ** P <0.01.