View larger version:
Download Original File
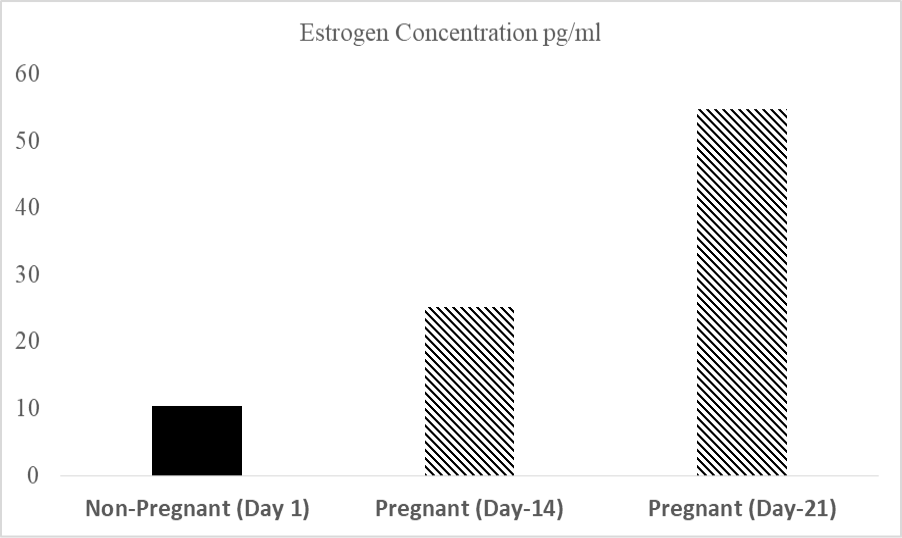
Figure 1:
Graphical representation of MEAN±SEM Values for serum estrogen values in both group of camels.