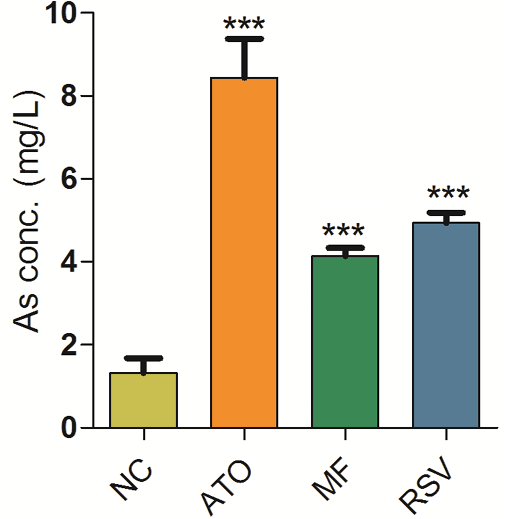
Fig. 3.
Arsenic concentration in the liver sample is detected by HG-AAS. For statistical details and abbreviations, see Figure 1. *** represents P < 0.001 when compared with NC group. As, arsenic; HG-AAS, hydride generation atomic absorption spectroscopy.