View larger version:
Download Original File
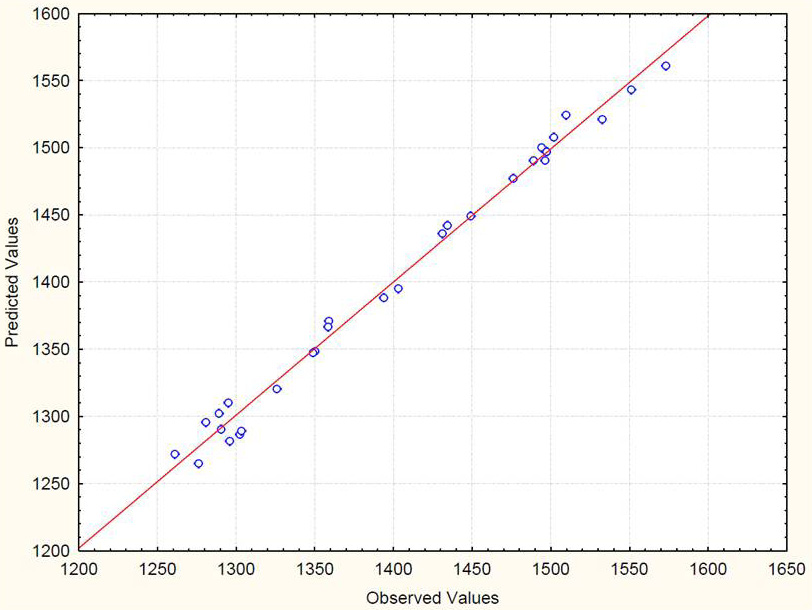
Figure 4:
The graph between observed and predicted values for the production of protease enzyme.