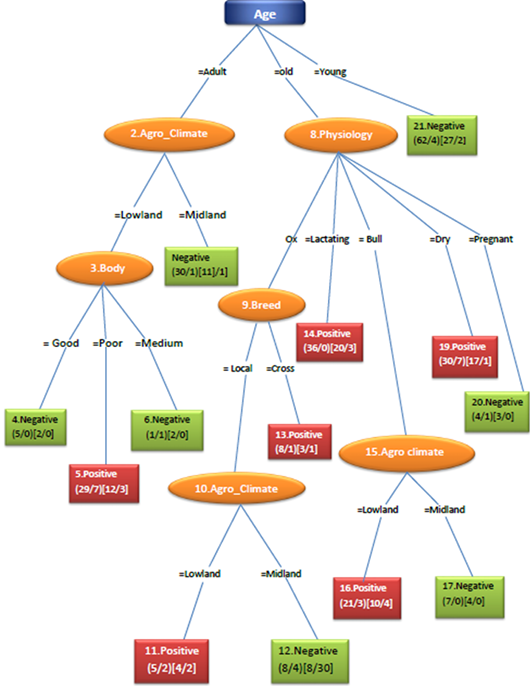
Visual representation of the REP Tree to see the hidden relation of the attributes for the disease occurrence