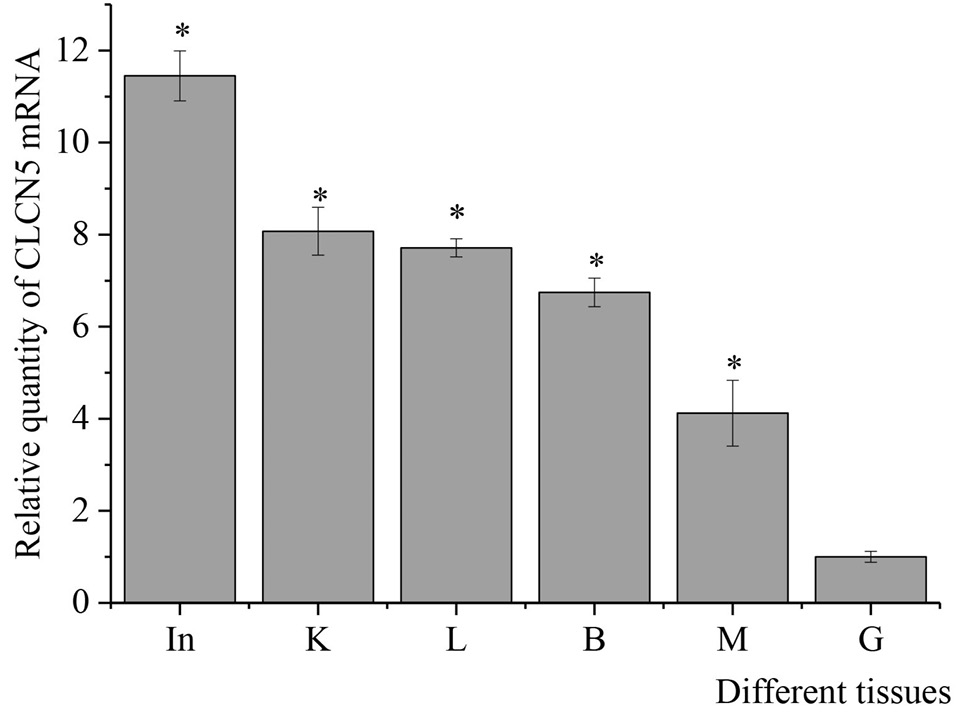
Fig. 4.
Relative expression level of CLCN5 mRNA in different tissues of Takifugu rubripes by quantitative real-time PCR analysis. The tissues include gill (G), liver (L), brain (B), muscle (M), intestine (In), and kidney (K). After normalization to β-actin, relative expressions of TrCLCN5 mRNA were calculated using the 2-ΔΔCt method. Bars represent the mean ± SD. The * indicates significant differences (p < 0.05).