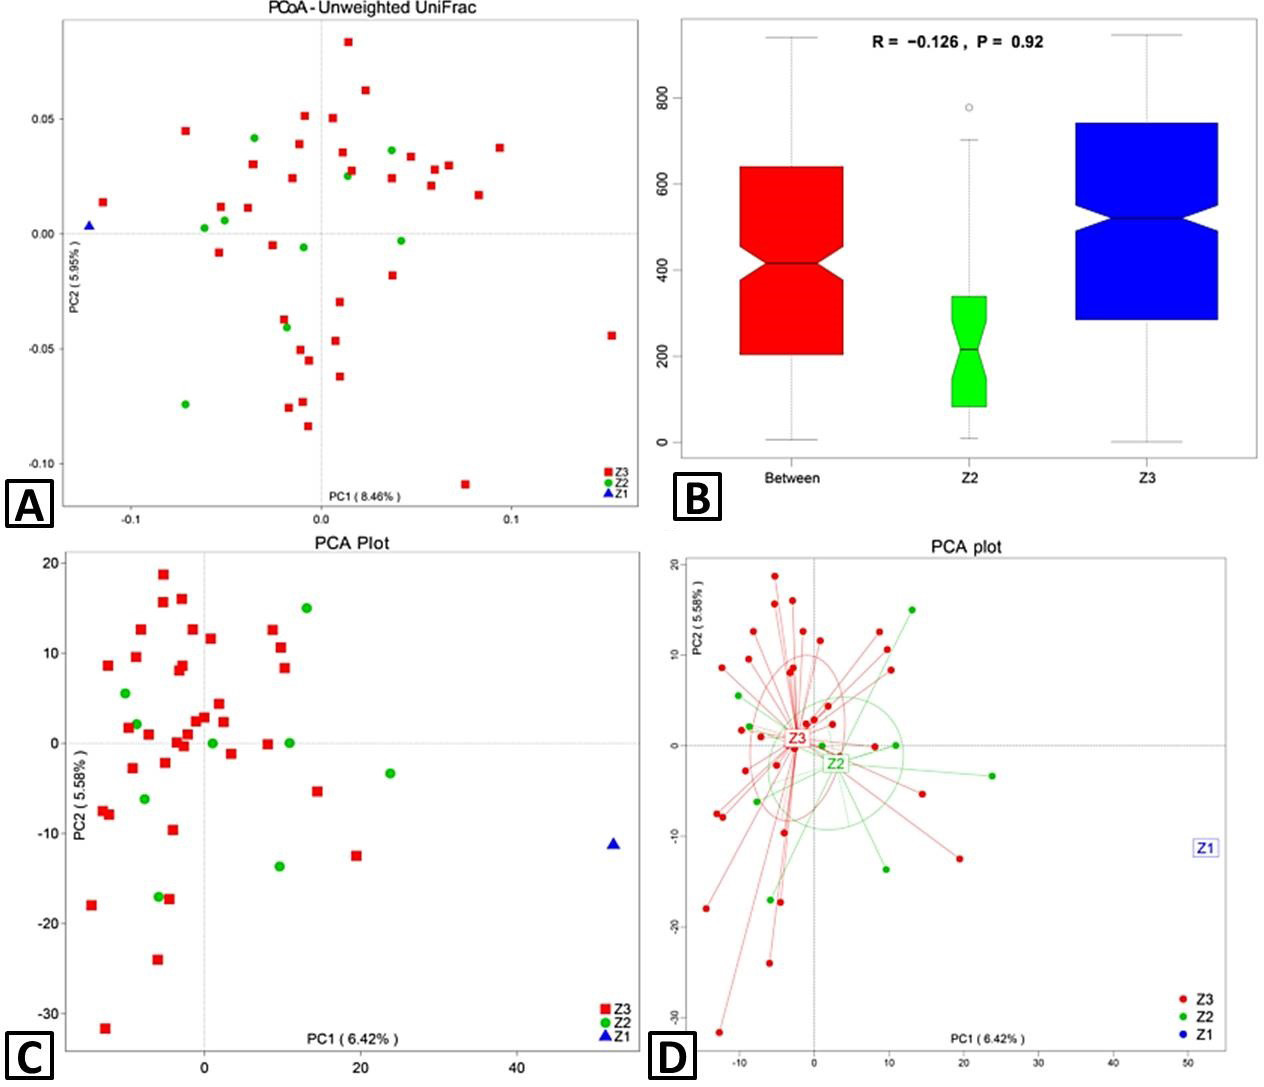
Beta diversity. Principal coordinates analysis (PCoA) 2D images were developed using unweighted UniFrac (A) and distance matrices. (B) ANOSIM (analysis of similarities) analysis. Principal component analysis (PCA) plot (C) was drawn based on OTUs levels. (D) PCA plot clustering by groups. Each sample is represented by a point with Z1 in blue triangle, Z2 in green cycle and Z3 in red square R-value: R-value range (–1, 1). Actual results are generally between 0 and 1. An R-value close to 0 represents no significant inter-group and intra-group differences, whereas the R-value close to 1 shows that inter-group differences are greater than intra-group differences. P-value: The P-value represents the confidence level of the statistical analysis; P < 0.05 reflects a statistically significant difference. The y-axis represents the distance rank between samples, and the x-axis represents the results between both groups. Intra-group results are shown for each group. In the plot, the R-value was negative and close to 0, indicating no differences, and P > 0.05 shows that this result was not statistically significant. Z3, adult; Z2, sub-adults; Z1, infant.