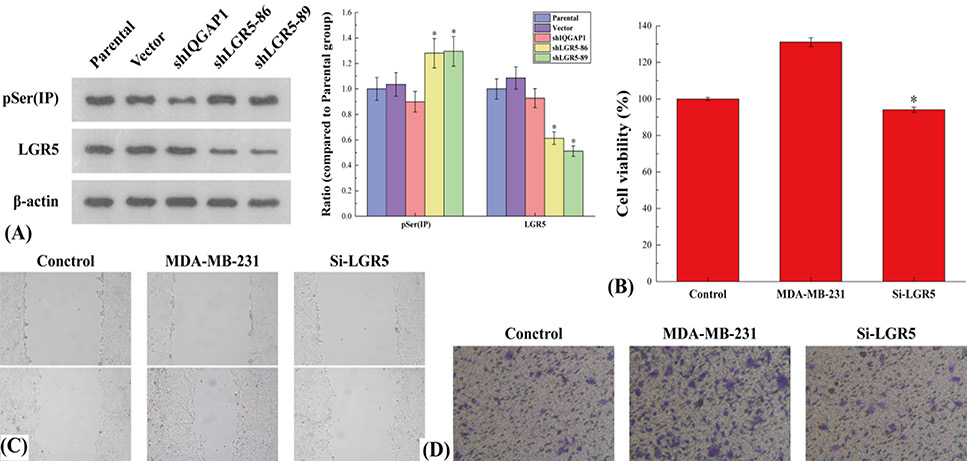
(A) The results of Western blot analysis of the expression of LGR5 and phosphorylated IQGAP1 (pSer(IP)) in human normal breast cell line, metastatic human breast cancer cell line and LGR5-knockdowned MDA-MB-231 cell line, including the original gel image and the relative values of LGR5 and pSer(IP). The symbol * means p < 0.05 compared to Parental and Vector groups. (B) The results of CCK8 assay analyzing the relative cell viability of the three cell lines after 24 h of culture. The symbol * means p < 0.05 compared to MDA-MB-231 group. (C) The results of cell scratch test to analyze the migratory ability of cells in the three cell lines. (D) The results of transwell detection to analyze the invasive ability of cells in the three cell lines.