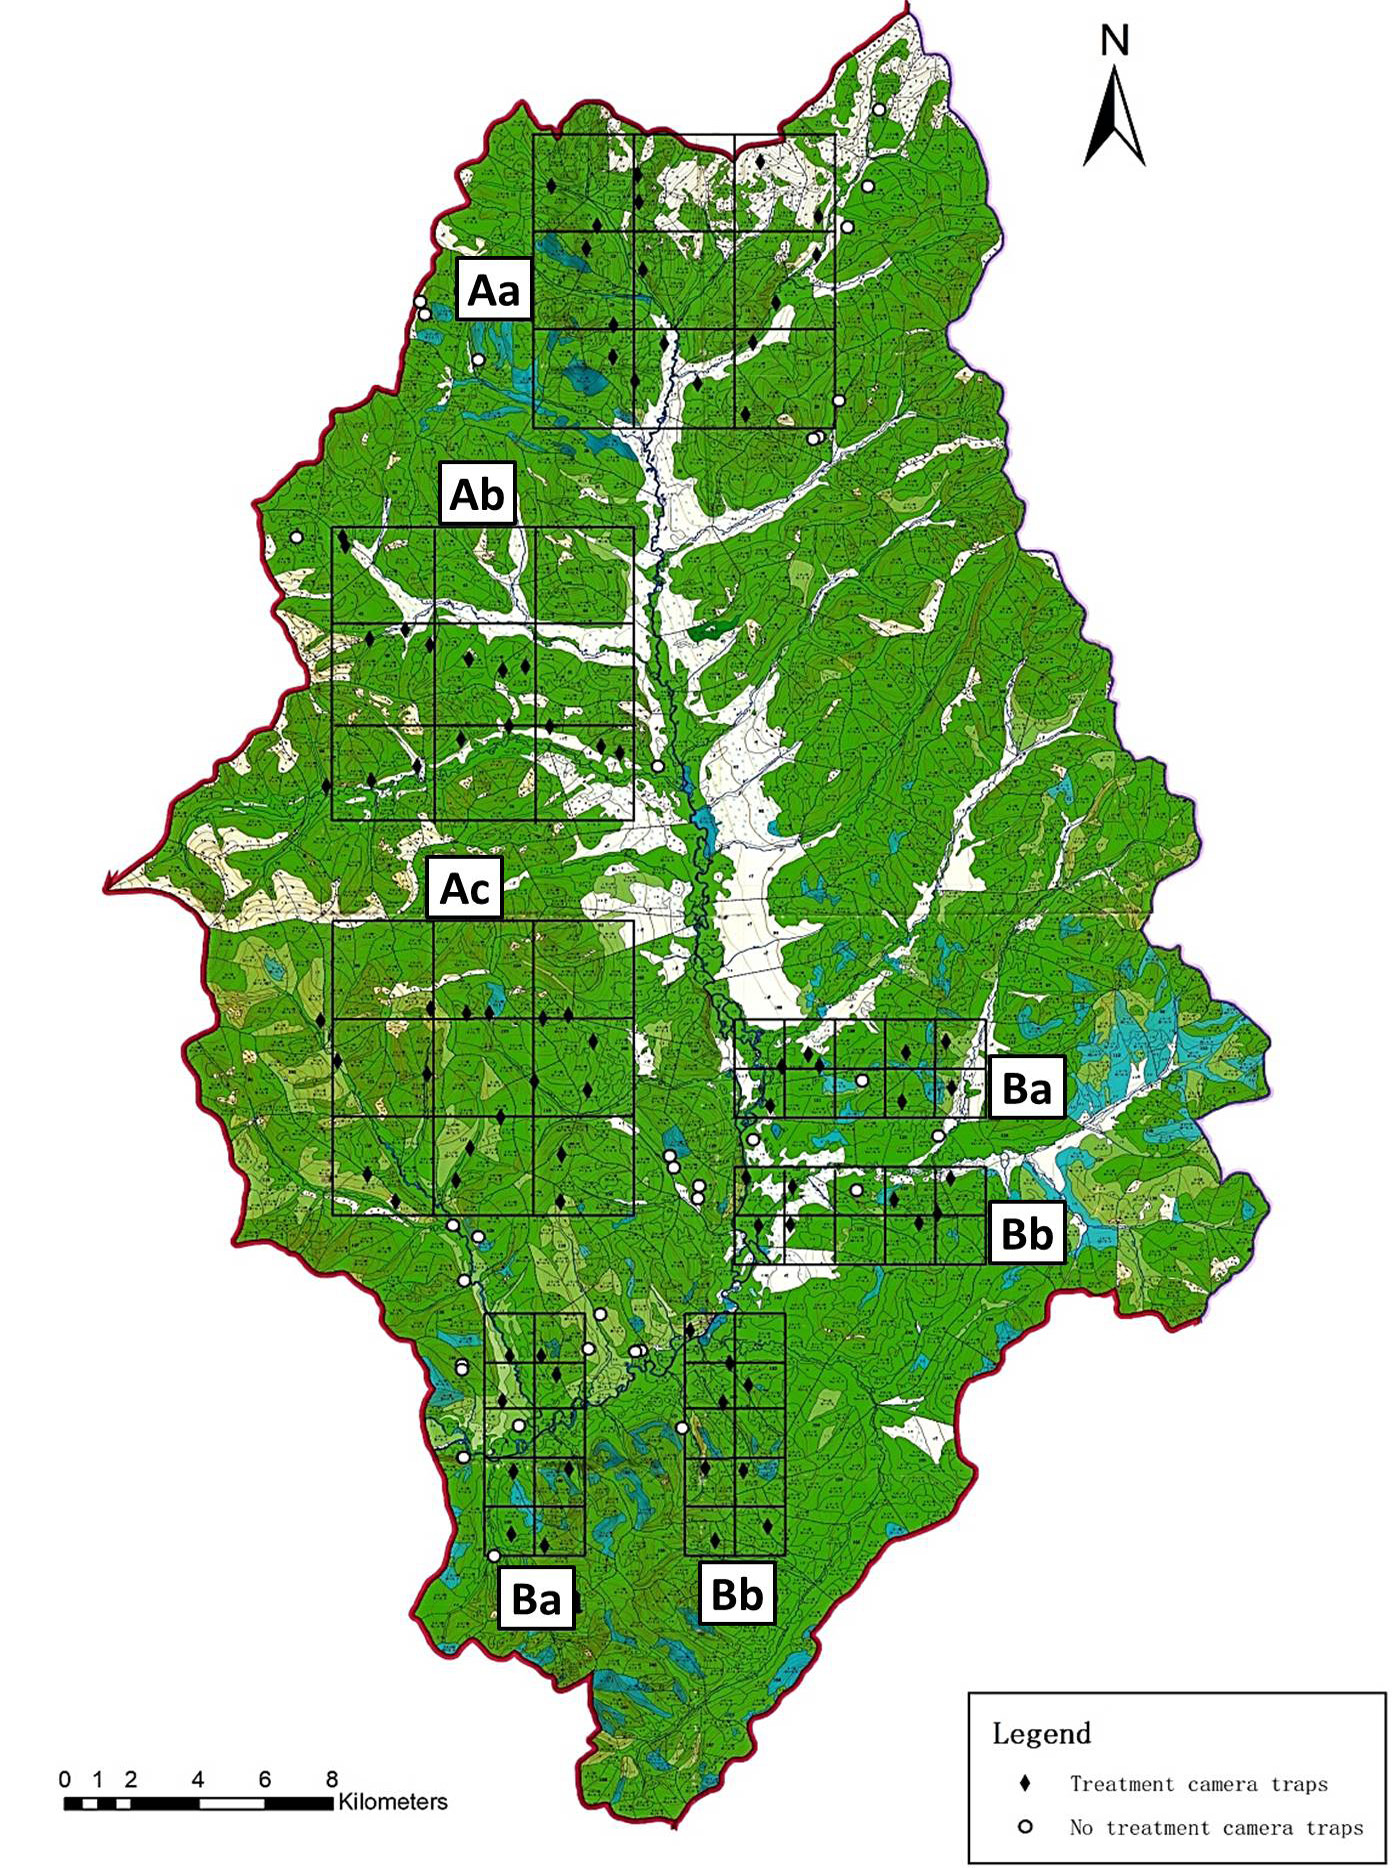
Experimental sites and camera trap distribution in Hanma National Nature Reserve. Black boxes indicate reserve areas selected for experimental treatment group sites as determined by the fishnet method in ArcGIS 9.3. Then A- visual cue experiment (Aa- tiger, Ab- bear, Ac- control), and the odour cue experiment comprises of (Ba- tiger, Bb- control). Tiger visual (Aa) includes a life-size photo of a standing tiger printed on a canvas which is tied to two trees that are side by side, with a camera tied to one of the trees; the same size and settings were for the bear visual (Ac). For the control visual (Ac), a canvas with the same size as tiger and bear visual cues was printed with vegetation colour to mimic the habitat and then tied side by side to two trees with a camera tied to one of the trees to record visitation incidences. For the tiger odour cue experiment (Ba, b), a plastic bottle with tiger feces (i.e., Ba groups) was tied to a tree, and then a camera is tied to the opposite tree to record the visitation rate; the same was done to odour cue control (Bb) groups, but here the bottle was filled with soil. Finally, there were cameras at no treatment sites indicated as white round; spots with neither treatment nor control. Red circles indicate individual camera trap sites each of which includes one motion-triggered camera.
