
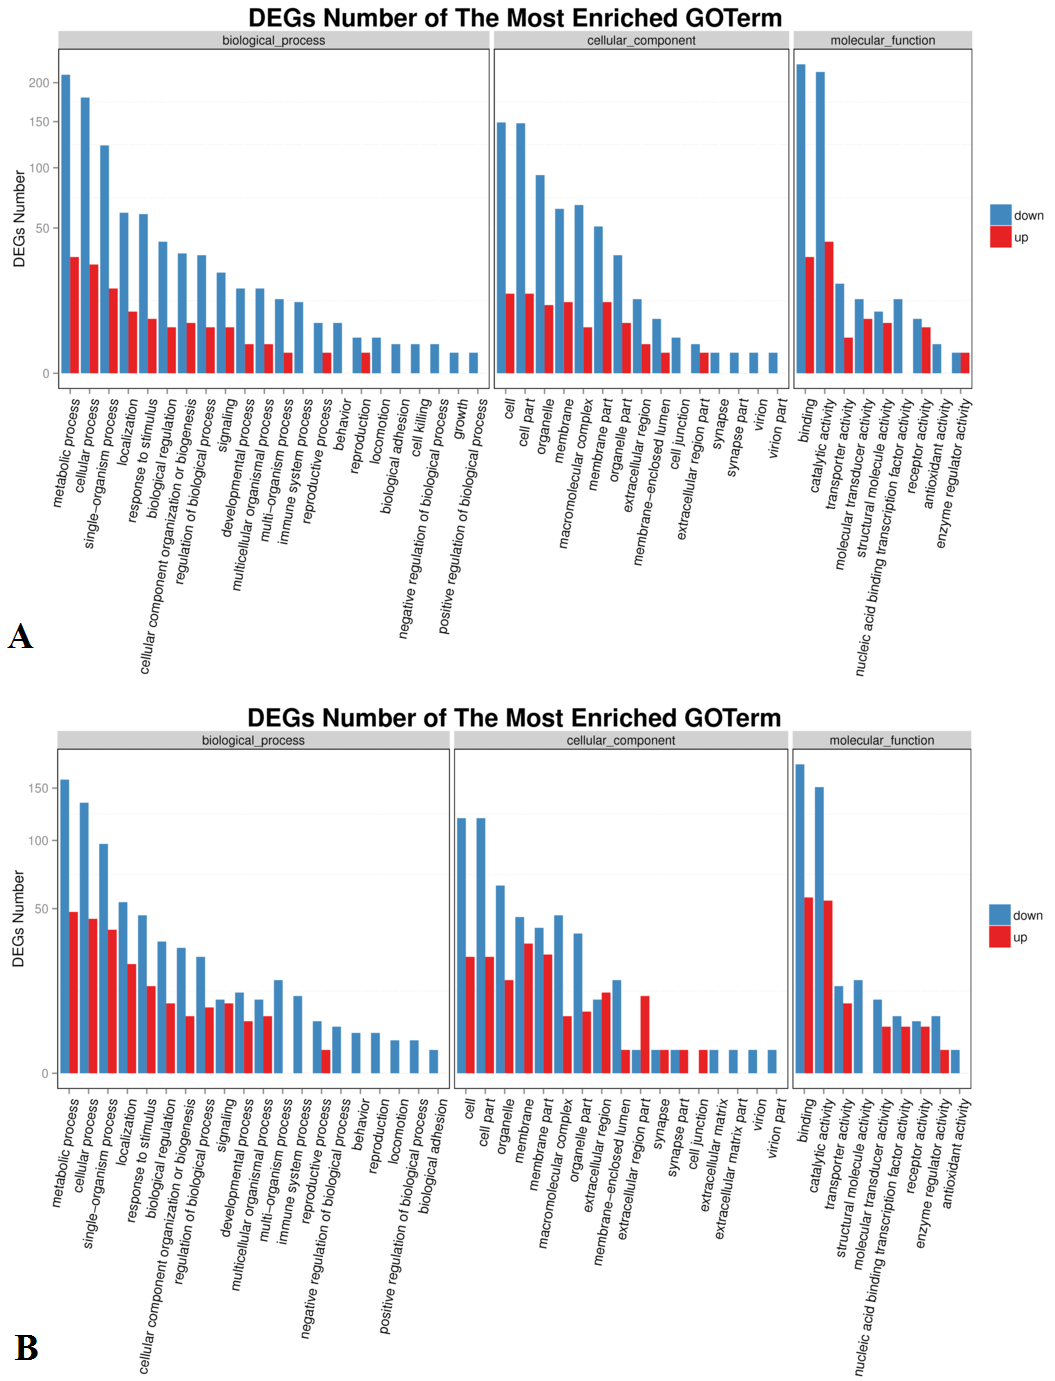
Fig. 2.
GO classification of up-regulated and down-regulated genes. (A) Lan5; (B) Mysore. X axis represents GO term. Y axis represents the amount of up/down-regulated genes in a category.
GO classification of up-regulated and down-regulated genes. (A) Lan5; (B) Mysore. X axis represents GO term. Y axis represents the amount of up/down-regulated genes in a category.