
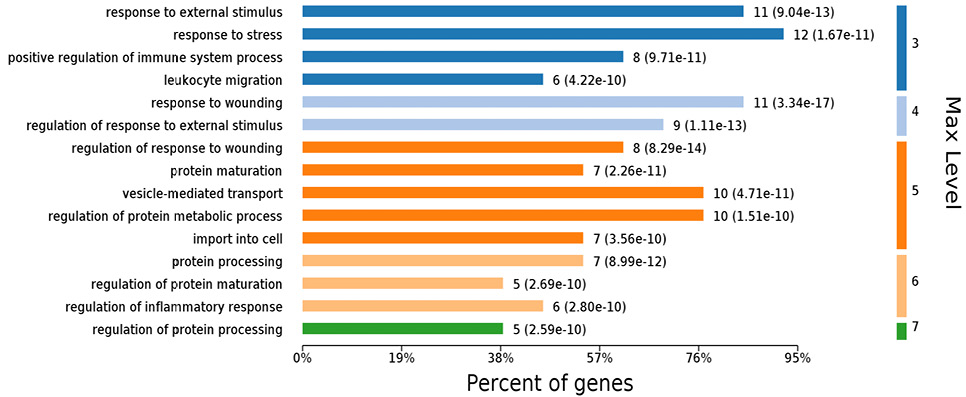
Fig. 3.
Biological processes involving the differentially expressed proteins. Each bar includes the number of genes and p-value calculated with Fish exact test with Hypergeometric algorithm. Max level means maximal annotated level of this term in the GO graph.