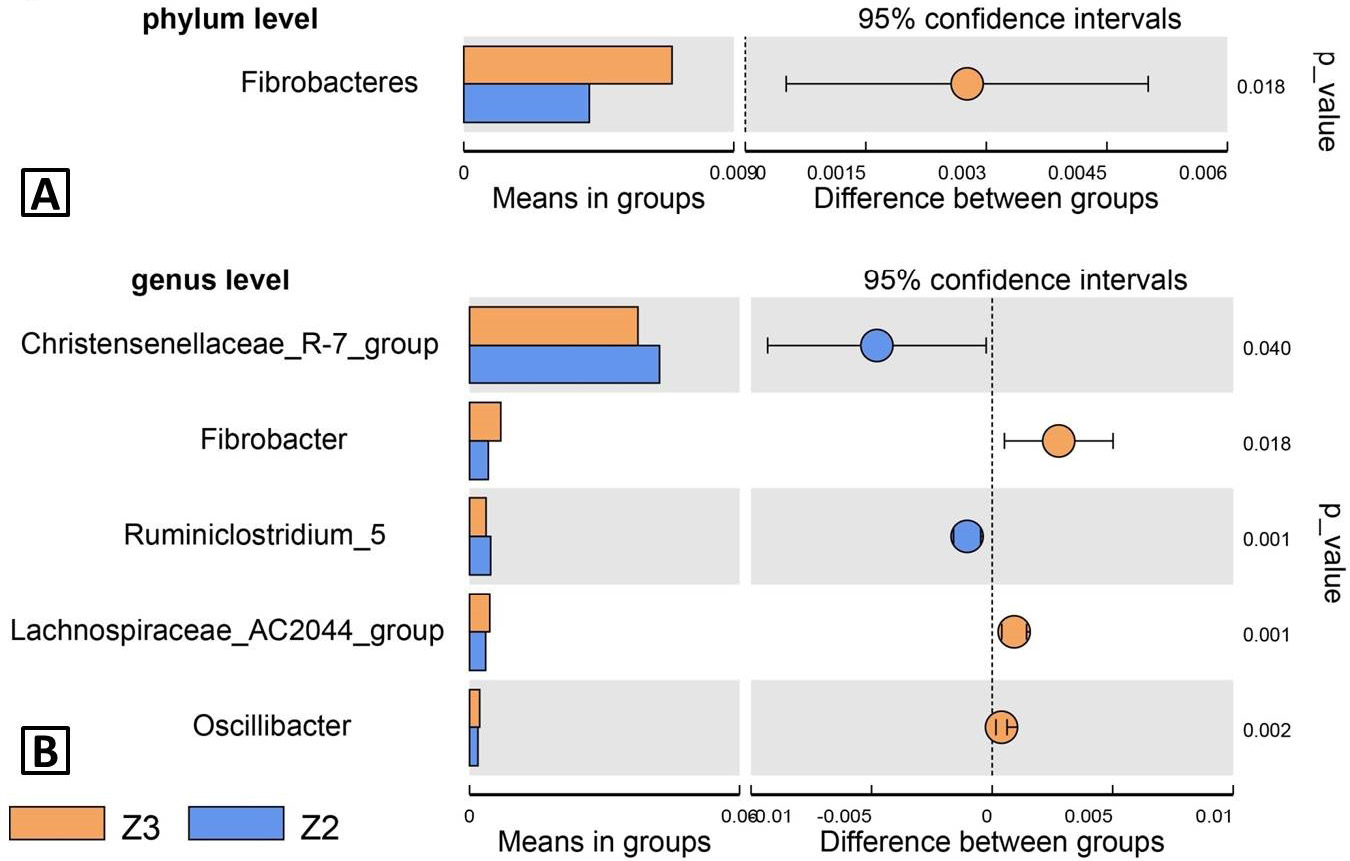
Fig. 7.
Species used to differentiate Z2 from Z3 by T-test. A, Bar plot of species with different abundance at phylum level; B, bar plot of species with different abundance at genus level. Each bar represented the mean value of relative abundance of specie. The right plot showed the confidence intervals of 95%, and the cycle whose colour represented the group was the average difference. The best values were p values. Z3, adult; Z2, sub-adults; Z1, infant.