View larger version:
Download Original File
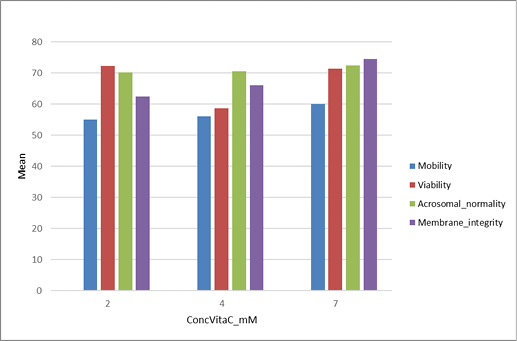
Figure 2:
Graphical distribution of Vit C compared to semen characteristics.