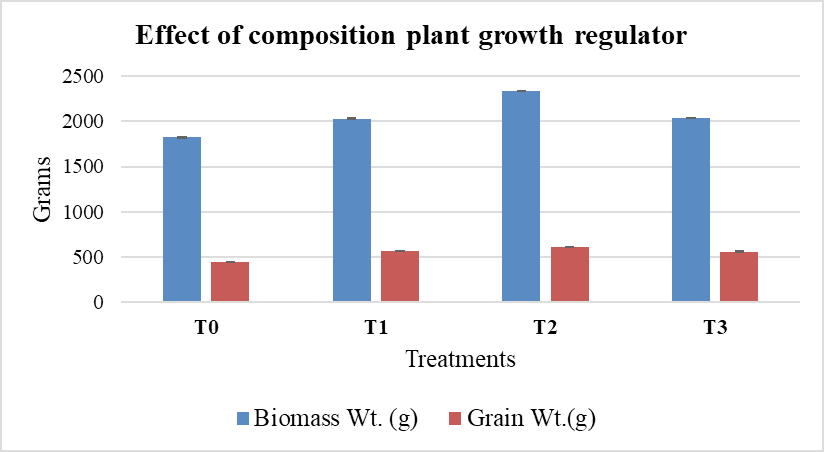
Figure 2:
Graph showing effect of various PGRs on biomass weight and grain weight in one-meter square area experiments (replicates) in a single green house of Sayban International, Lahore (Pakistan) where T0 (Control), T1 (100ppm), T2 (150ppm) and T3 (200ppm) represent the concentration of PGRs spray.