View larger version:
Download Original File
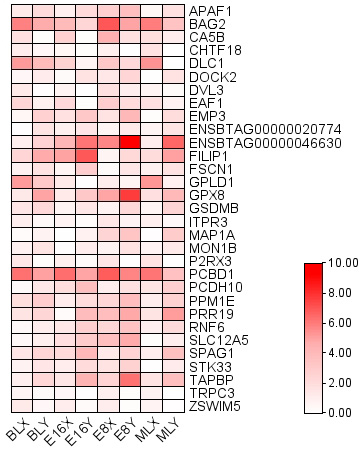
Fig. 4.
Heatmap shows the gene expression of XX and XY embryos at different periods.
