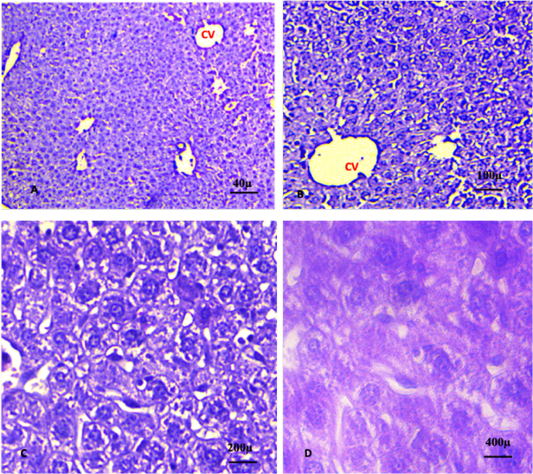
Figure 4:
A, B, C, D shows liver of the control group 3 (plant extract alone). The sections revealed normal organisation of the hepatic cells surrounded the central vein. (CV): central vein. (A. X 4, B. X10, C.X20, D. X40). (H and E).
A, B, C, D shows liver of the control group 3 (plant extract alone). The sections revealed normal organisation of the hepatic cells surrounded the central vein. (CV): central vein. (A. X 4, B. X10, C.X20, D. X40). (H and E).