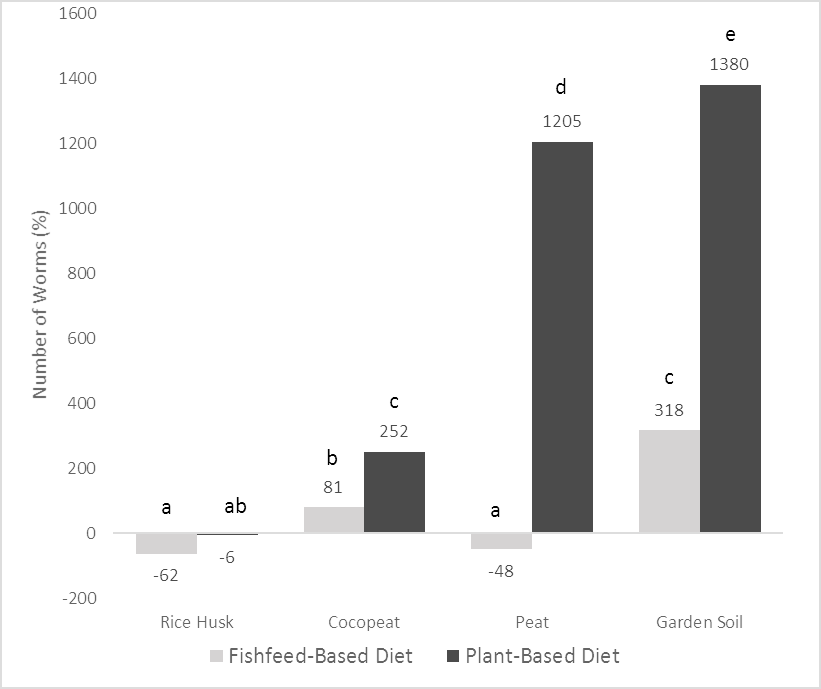
Fig. 1.
Bars shows the worm numbers as percentage. Comparison done by substrate types and each bar belongs to different feed treatment. The zero point (-) of the graph is initial worm density (7 worms/100 cm3). Lines on the bars shows errors and letters represents the significant differences between treatments (p-value given in the text as they are differentiated according to the experimental group).