View larger version:
Download Original File
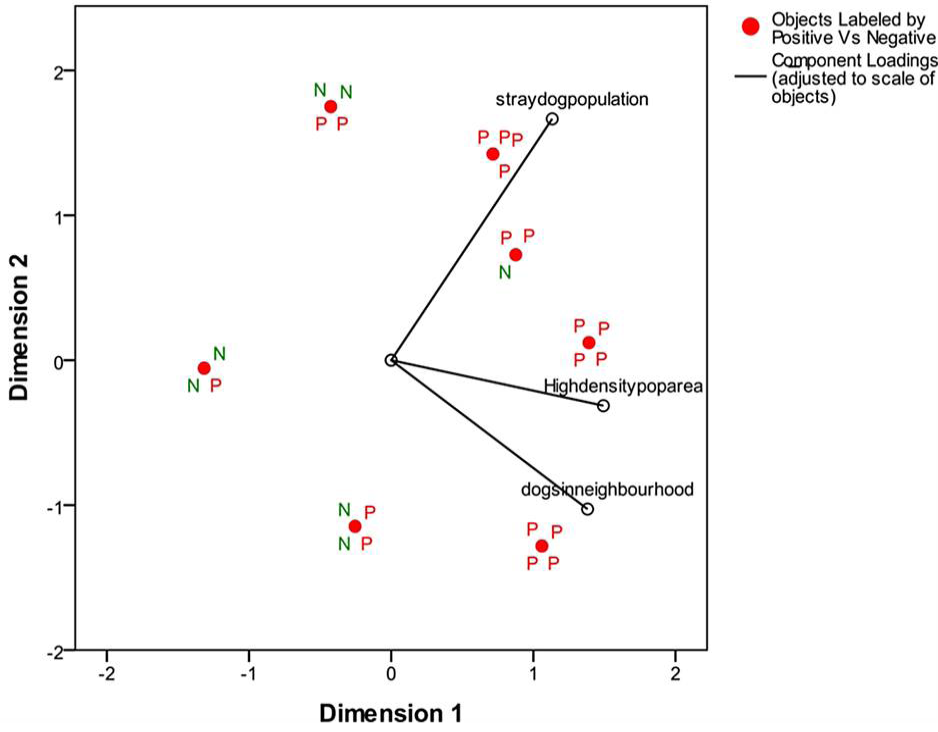
Fig. 6.
CATPCA and biplots among 3 selected variables from univariate analysis.