
Fig. 5.
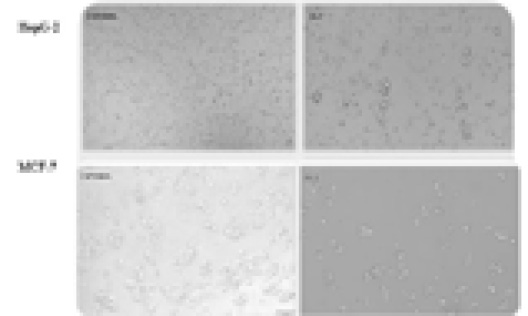
Change in morphology of HepG-2 and MCF-7 cells after treatment with varying concentrations of IL-2 (250ng-10,000ng) for 48 h. (Magnification=10X, Resolution= 200um).
Change in morphology of HepG-2 and MCF-7 cells after treatment with varying concentrations of IL-2 (250ng-10,000ng) for 48 h. (Magnification=10X, Resolution= 200um).