View larger version:
Download Original File
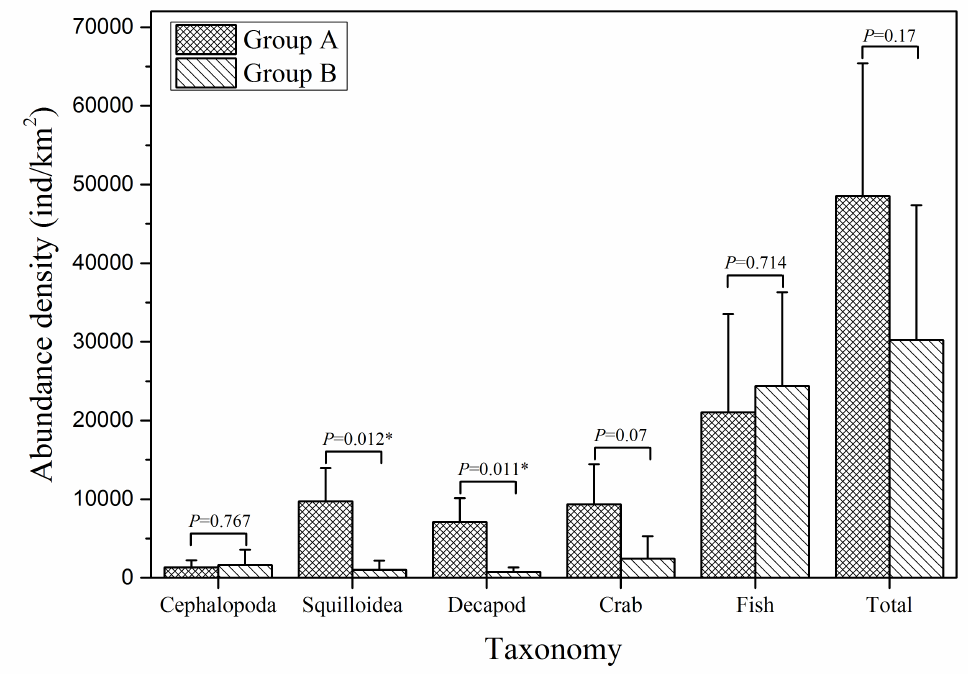
Fig. 3.
Spatial variation of nekton densities (mean±SD, ind/km2) between group A and B.
