
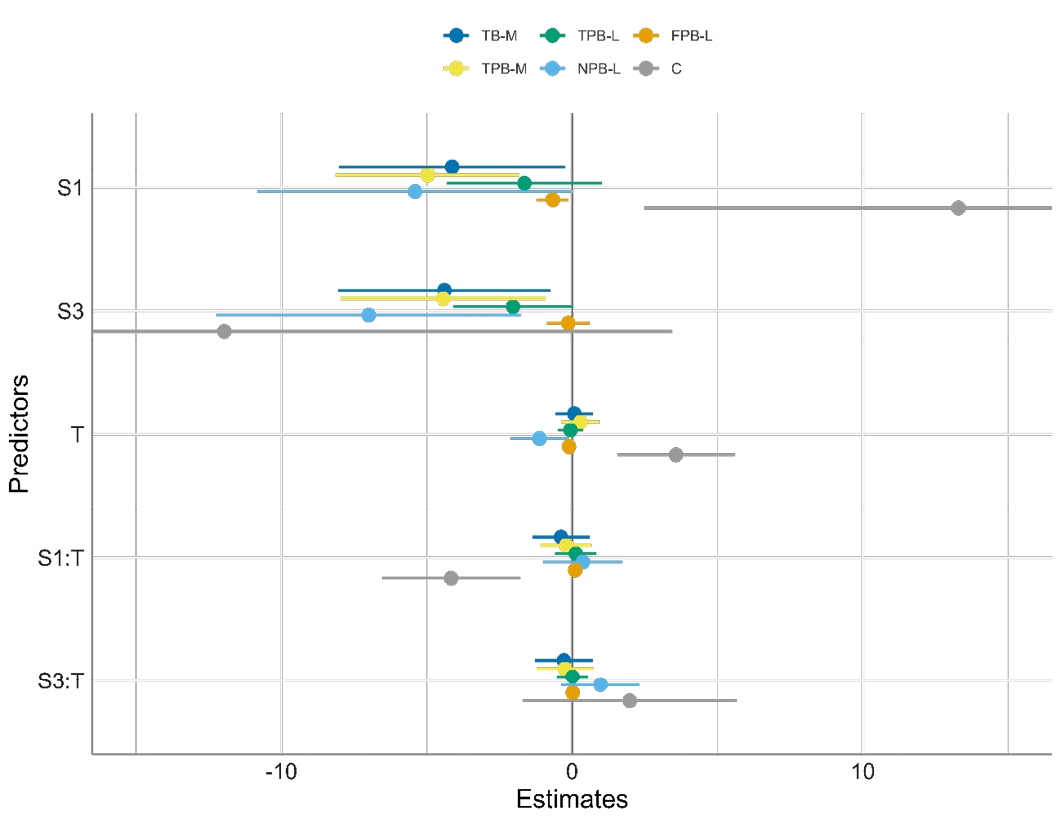
Model results with significant estimates. Effects of high (S3) and low (S1) shadow levels, time (T) and S x T interaction on dependent variables, compared to a shadow level as a control (S2=0). Total branches in the middle third (TB-M) and lower third (TB-L); Total productive branches in the middle third (TPB-M) and lower third (TPB-L); Nodes of a productive branch in the middle third (NPB-M) and lower third (NPB-L); Productive nodes of a productive branch in the middle third (PNPB-M) and lower third (PNPB-L); Fruits (or flowers) in productive branches of the middle third (FPB-M) and lower third (FPB-L); Relative amount of chlorophyll measured in SPAD units (C); Diameter (cm) of the stem of the coffee tree at 15 cm from the ground (D); Height (m) of the coffee tree (H).