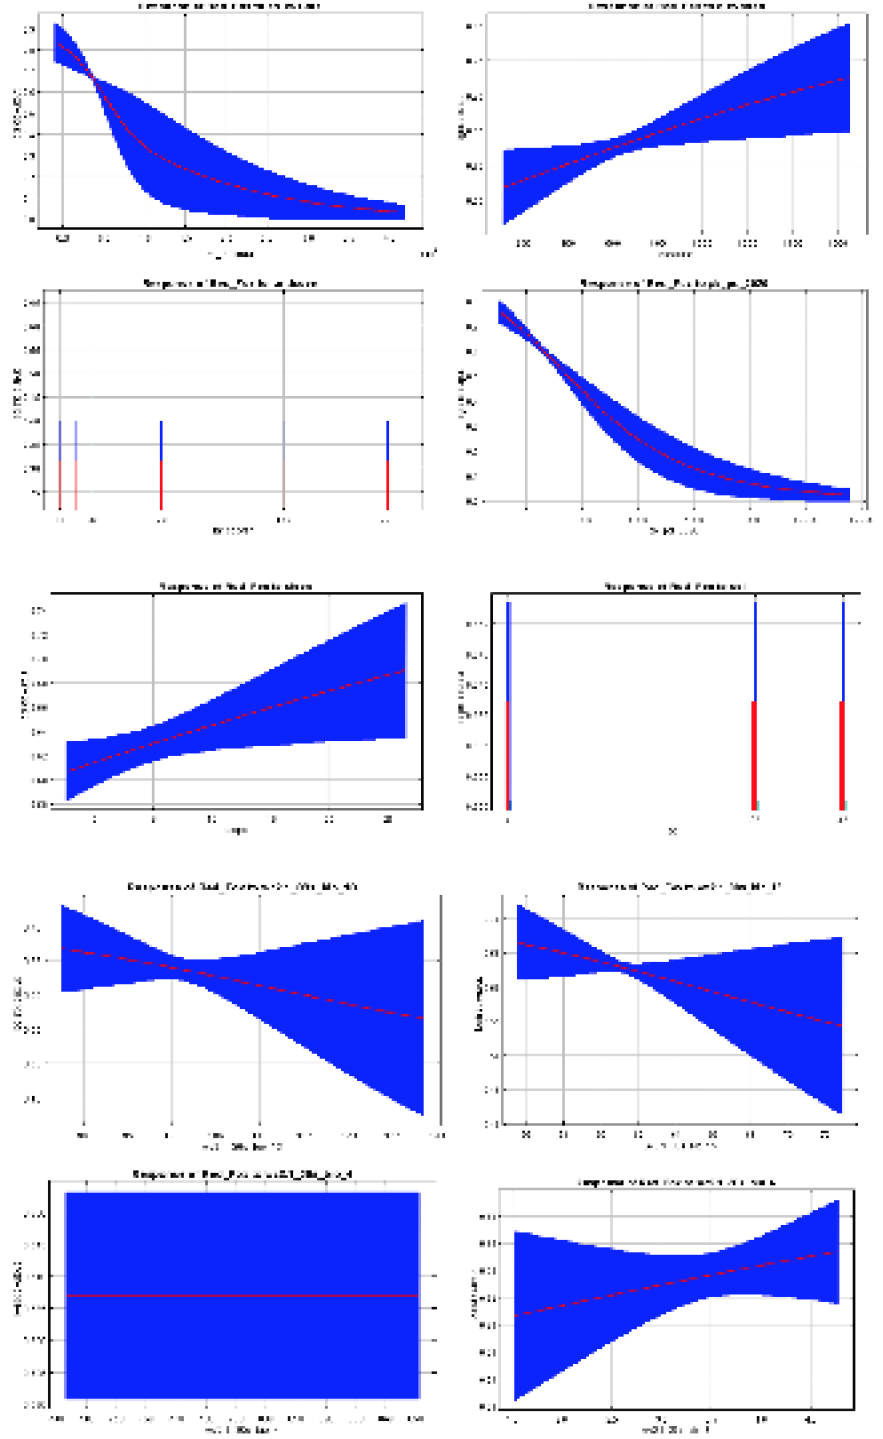
Fig. 4.
Response curves of predictors for red fox occurrence in the study area. The red curves show the mean response of the five replicate MaxEnt runs, while the mean +/− one standard deviation is indicated by blue (two shades for categorical variables). The predicted value of habitat suitability (logistic output) is shown on the Y-axis, while the range of the environmental predictors is shown on the X-axis.