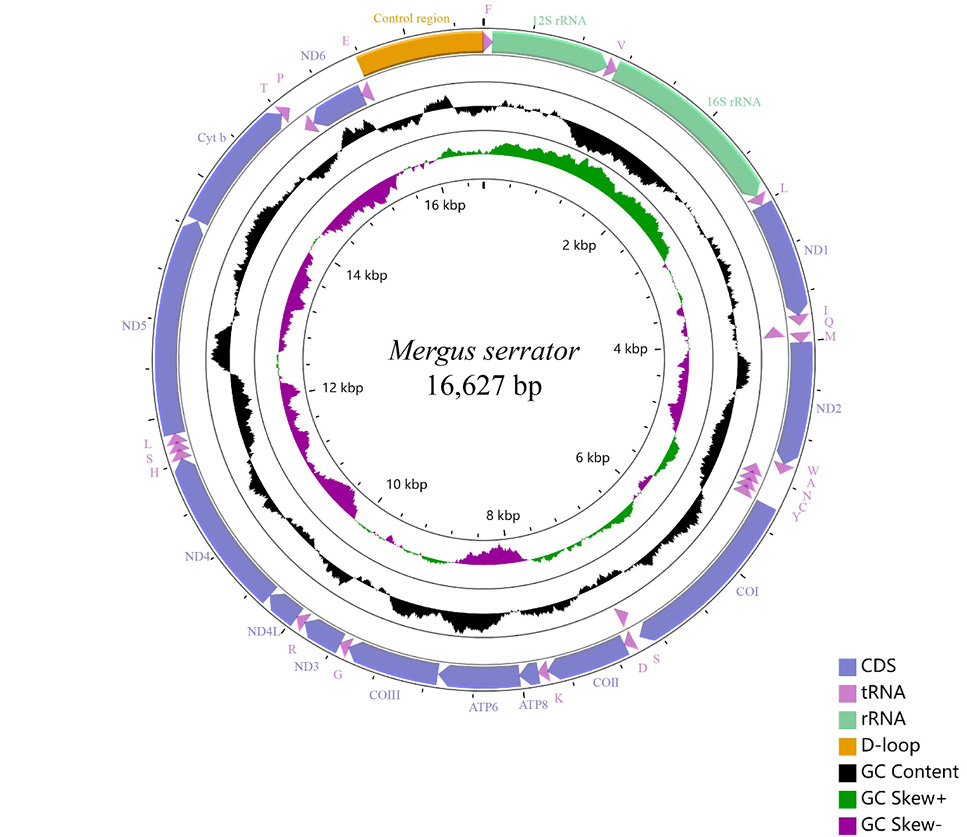
Fig. 1.
Mitochondrial genomes of M. serrator. Arrows indicate the orientation of gene transcription. PCGs are shown as blue arrows, rRNA as light green arrows, control region as orange arrows, and tRNA genes as purple arrows. tRNA genes are designated by single-letter amino acid abbreviations. Labeling from the outside to the inside circle: genes encoded on the heavy strand, genes encoded on the light strand. The black circle demonstrates the GC content (the peaks outside/inside the circle indicate values higher or lower than average GC content). The purple-green circle demonstrates GC skew, purple (between 0 and 1), and green (between -1 and 0).