
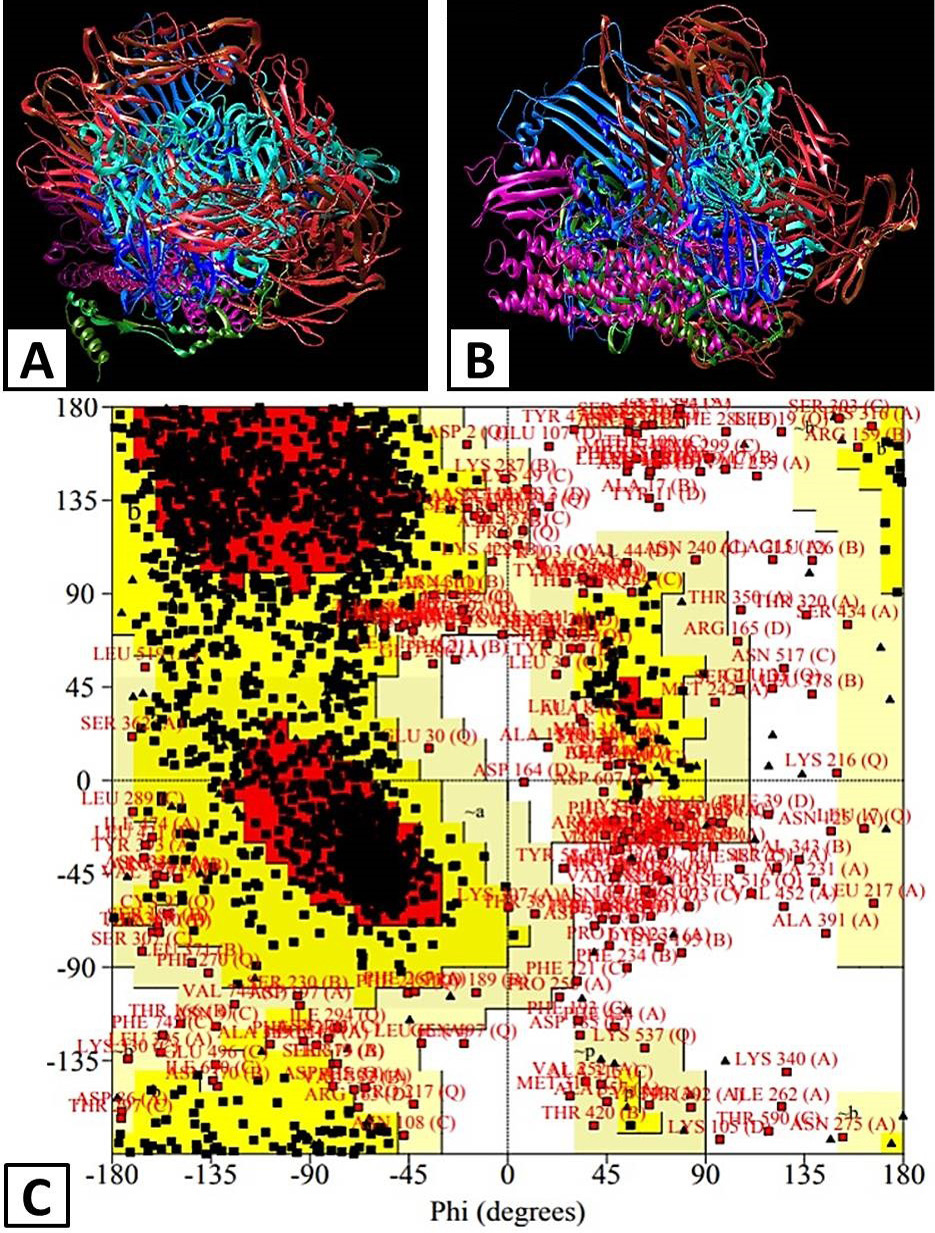
Fig. 2.
Predicted Model of APOB protein by using UCSF Chimera. a) Front view of the predicted model. B) Lateral view of the predicted model. C) Ramachandran plot of predicted APOB model by using PROCHECH. Region of A, B and L were considered core regions. a, b, l and p showed allowed region, ~a, ~b, ~l and ~p represents additional allowed region and XX for disallowed region.