
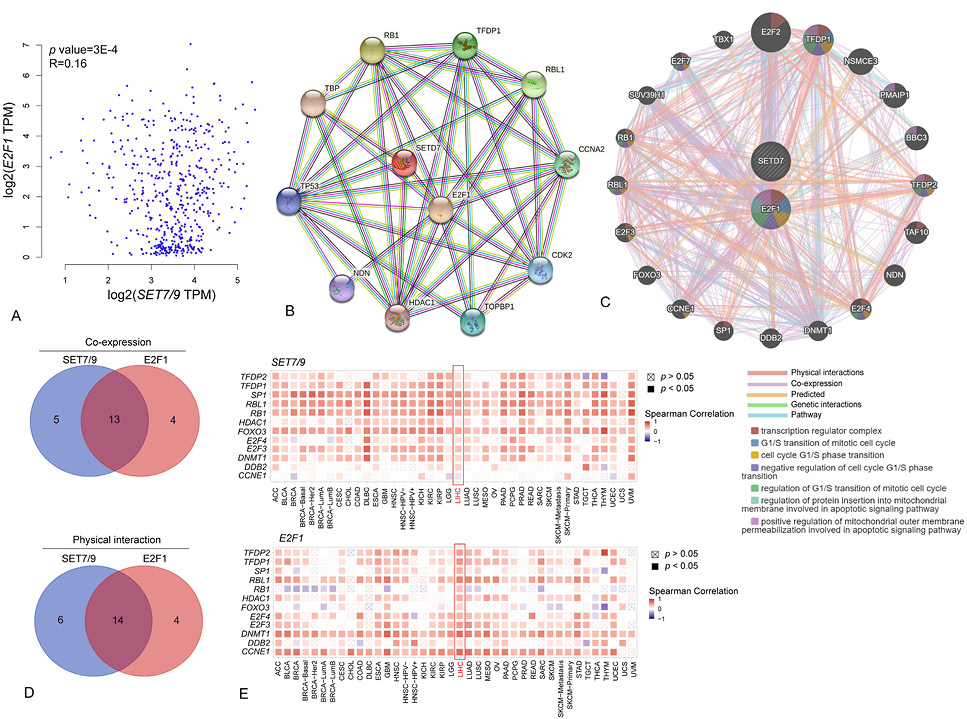
Co-expression and PPI network of SET7/9 and E2F1. (A) Correlation between SET7/9 and E2F1 mRNA expression levels in HCC. (B) Full STRING PPI network of SET7/9 and E2F1 based on the STRING database. The known interactors, predicted interactors as well as co-expressed functional partners of SET7/9 and E2F1 were shown. The colored lines linking two protein pairs indicate the type of protein-protein association. Blue, known interaction from curated databases; Purple, known interactions determined by experiment; Green, predicted interaction by gene neighborhood analysis; Black, co-expression. (C) Gene network of SET7/9 and E2F1 obtained from the GeneMANIA portal. The node colors indicate function of correlated genes/proteins and line colors indicate the type of protein-protein association. (D) Venn diagrams showing the intersection of proteins co-expressed with SET7/9 and E2F1 (upper panel) or physically interacted with SET7/9 and E2F1 (bottom panel) based on the results of network analyses using STRING and GeneMANIA. (E) Correlations between SET7/9 (upper panel) and E2F1 (bottom panel) with co-expressed genes in various cancer types. The heatmaps are presented according to the purity-adjusted partial spearman’s rho value as the degree of correlation.