
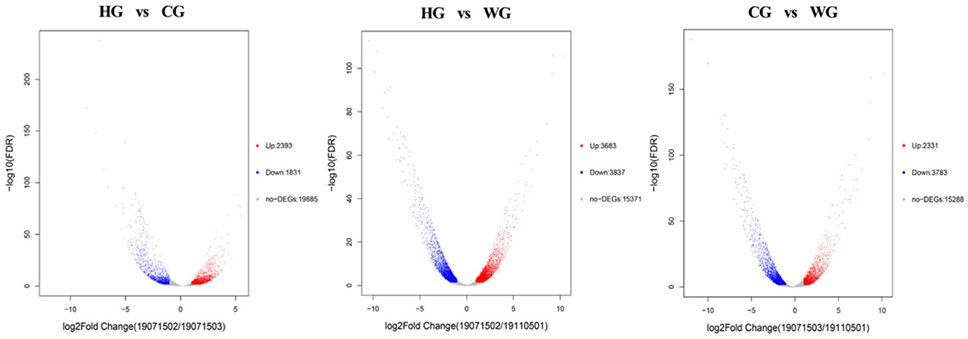
Fig. 3.
Volcano plot showing the gene expression differences between the WG group, HG group, and CG group. Each dot in the graph represents a specific gene or transcript. Red dots represent genes that are significantly up-regulated, blue dots represent genes that are significantly down-regulated, and gray dots represent genes that are not significantly different points on the left and top represent more significant expression differences.