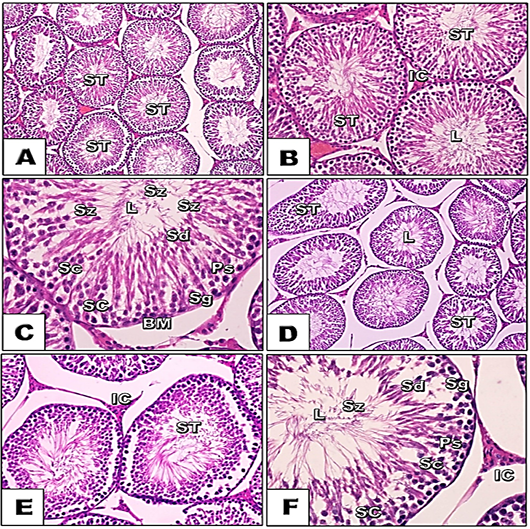
Figure 1:
Schematic diagram showing the histopathology of rats’ testicular tissues from the control group (A, B and C) and CC-treated group (D, E and F). ST = seminiferous tubules; IC = interstitial cells; L = lumen of the seminiferous tubule; BM = basement membrane; SC = Sertoli cells; Sg = spermatogonia cells. H & E X200, H & E X400.