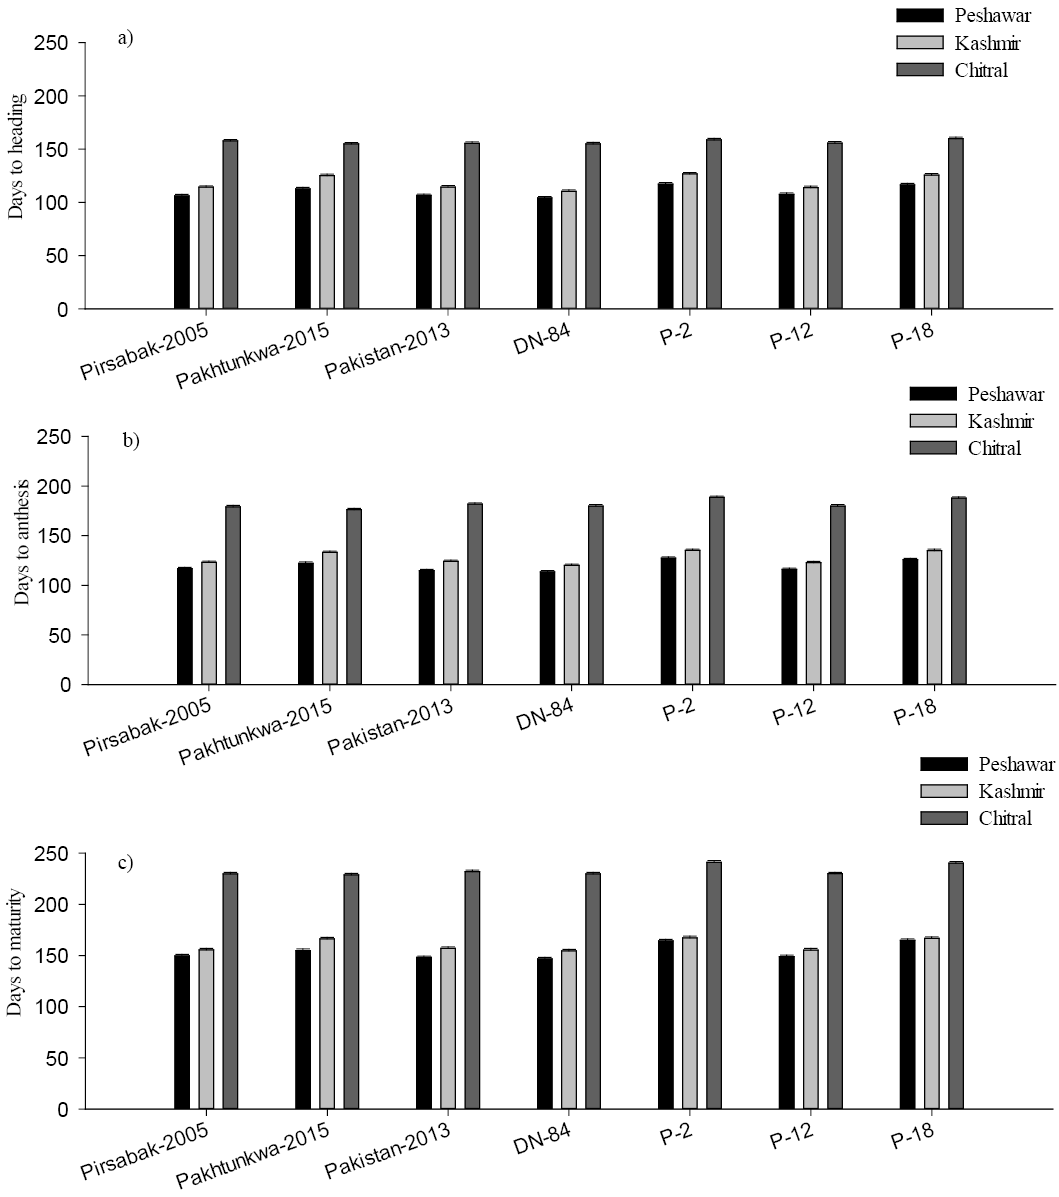
Figure 2:
Treatment interaction (genotypes x AE) in different windows (a) days to heading (b) days to anthesis and (c) days to maturity of wheat genotypes. LSD of mean is shown in vertical bars.
Treatment interaction (genotypes x AE) in different windows (a) days to heading (b) days to anthesis and (c) days to maturity of wheat genotypes. LSD of mean is shown in vertical bars.