
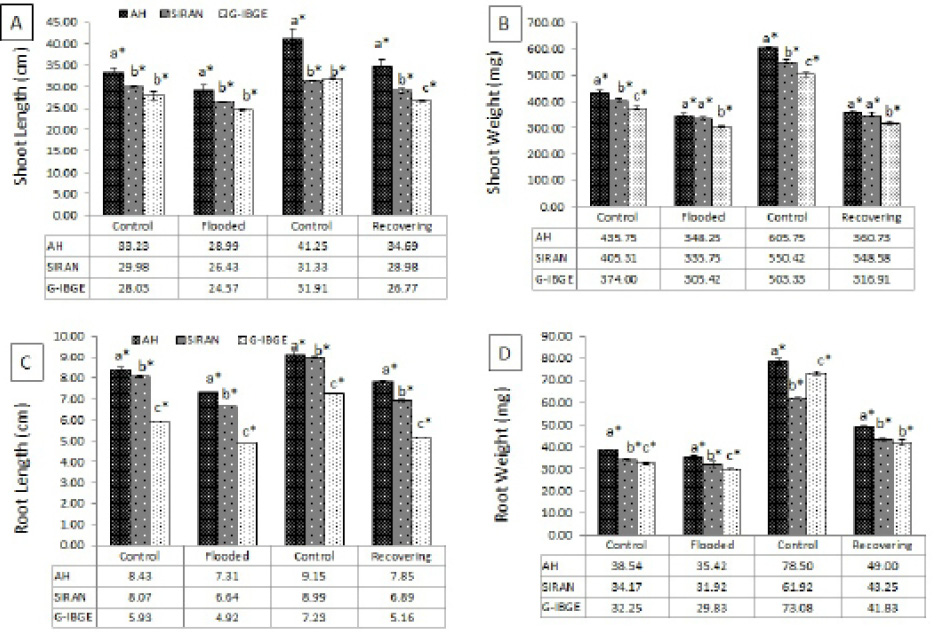
Figure 3:
Effect of flooding stress and post-flooding recovery on the shoot length, shoot weight, root length and root weight of wheat. The data represents mean of three replicates. Asterisks (*) represents significance at the level of p<0.05 when compared cultivar over time and cultivar over treatment through One-Way-ANOVA. Different alphabets depict LSD among the cultivars at a specific time-point.