Fig. 2.
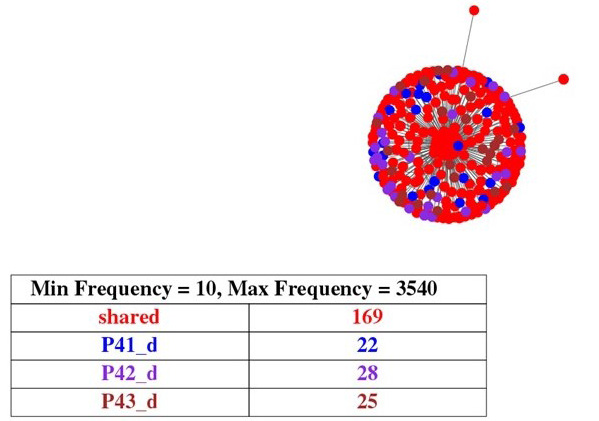
K step diagram showing the cluster formation of HBV of family, sharing the same genetic makeup. The red colour represents the same genetic sequences present in all samples.
K step diagram showing the cluster formation of HBV of family, sharing the same genetic makeup. The red colour represents the same genetic sequences present in all samples.