View larger version:
Download Original File
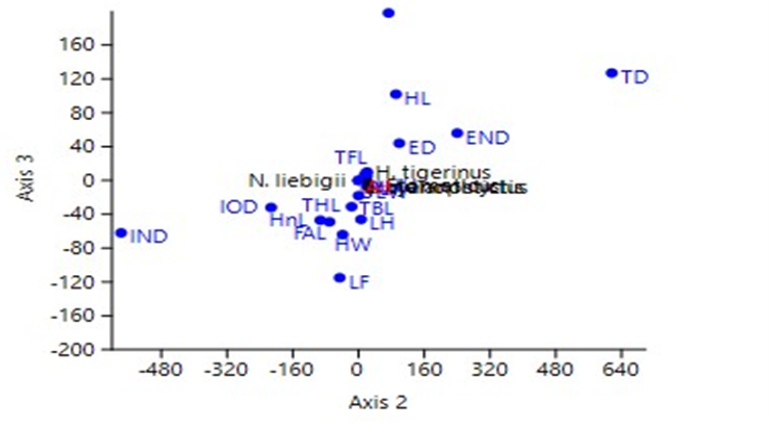
Figure 4:
DCA graph on the basis of morphometric variations.