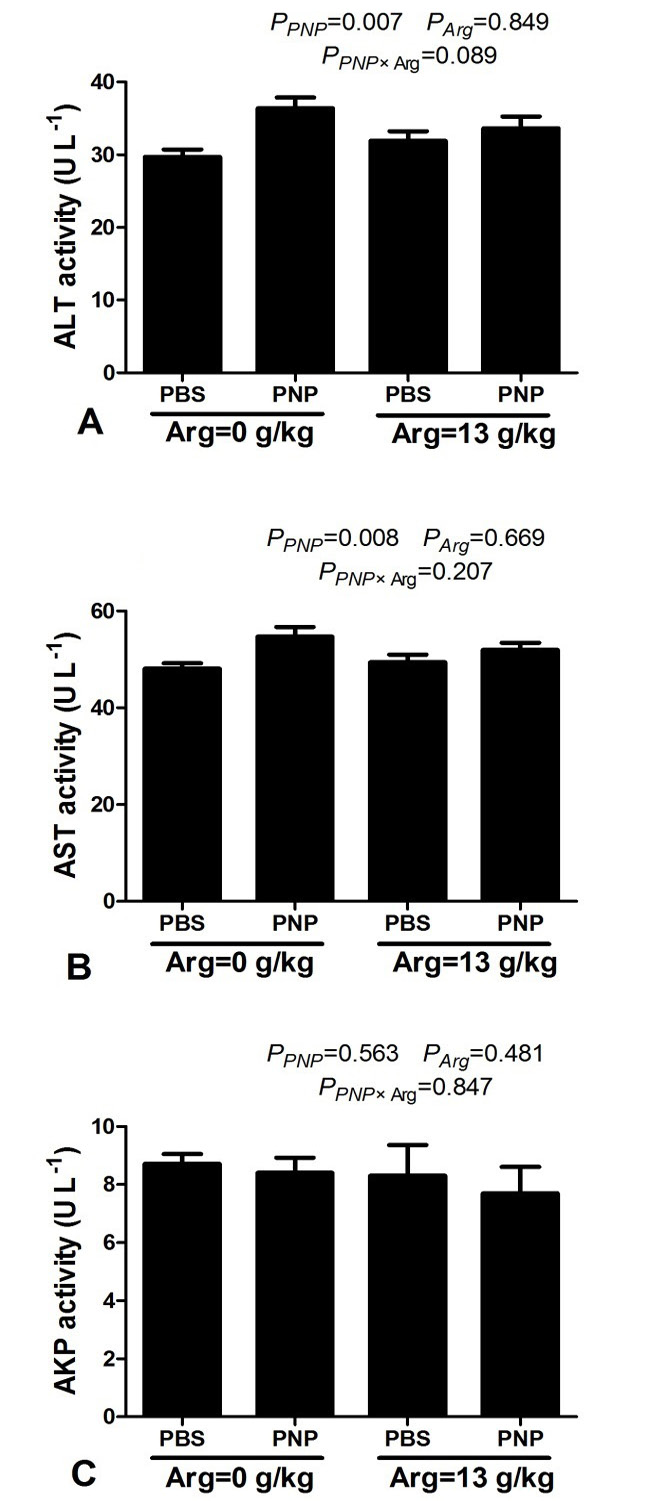
Fig. 2.
Effects of PNP and Arg exposure on serum. ALT activity (A), AST activity (B), and AKP activity (C). The statistical differences among groups were analyzed using a two-way analysis of variance (ANOVA) followed by Duncan’s multiple comparisons test. Bars represent the mean ± SEM. Differences between experimental groups were considered significant at p<0.05. (n=6).
