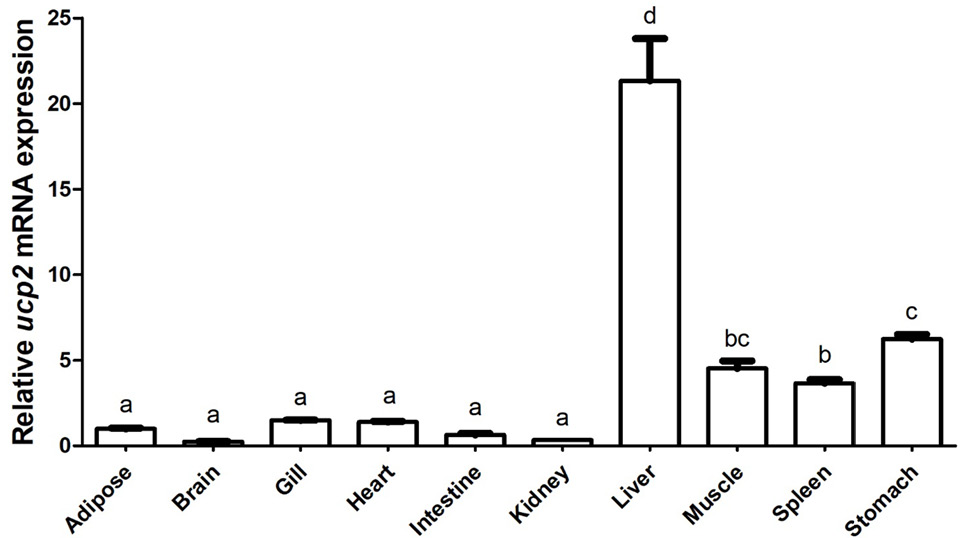
Fig. 4.
Relative mRNA expression of ucp2 in P. vachelli. Ten different tissues were calculated in the present study. The results were expressed as relative expression levels and standardized by β-actin gene. Error bars represent standard error of the mean (n = 6).