
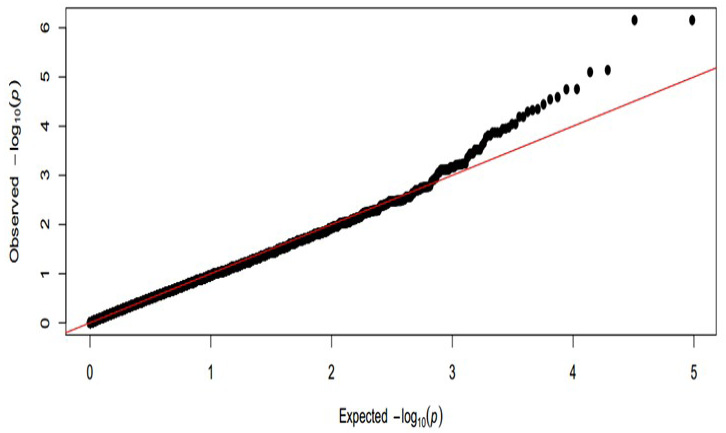
Fig. 2.
Quantile-Quantile plot of Chinese Merino sheep alopecia. Quantile-quantile plots from association with Merino sheep alopecia, where the red line shows the expected distribution. Comparison of p-value distributions when all the 48335 analyzed Illumina SNPs were included. The expected –log 10 (p) is on the x-axis and the observed –log 10 (p) is on the y-axis.