View larger version:
Download Original File
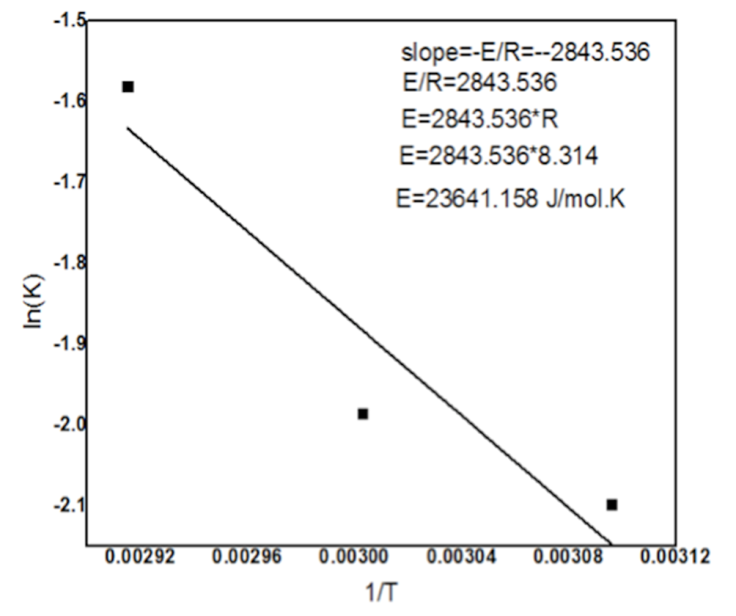
Figure 6:
Graph between 1/T and ln (k) showing slope and activation energy.