
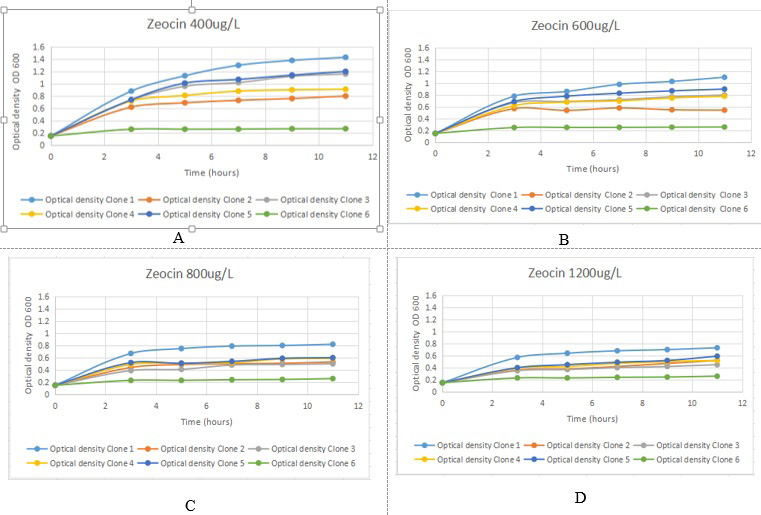
Fig. 2.
The productivity curves of transformed P. pastoris GS115 strains at different time intervals in gradually increasing Zeocin™ concentration i.e., A. 400 μg/μl B. 600 μg/μl C. 800 μg/μl and D. 1200 μg/μl concentration of Zeocin™.
The productivity curves of transformed P. pastoris GS115 strains at different time intervals in gradually increasing Zeocin™ concentration i.e., A. 400 μg/μl B. 600 μg/μl C. 800 μg/μl and D. 1200 μg/μl concentration of Zeocin™.