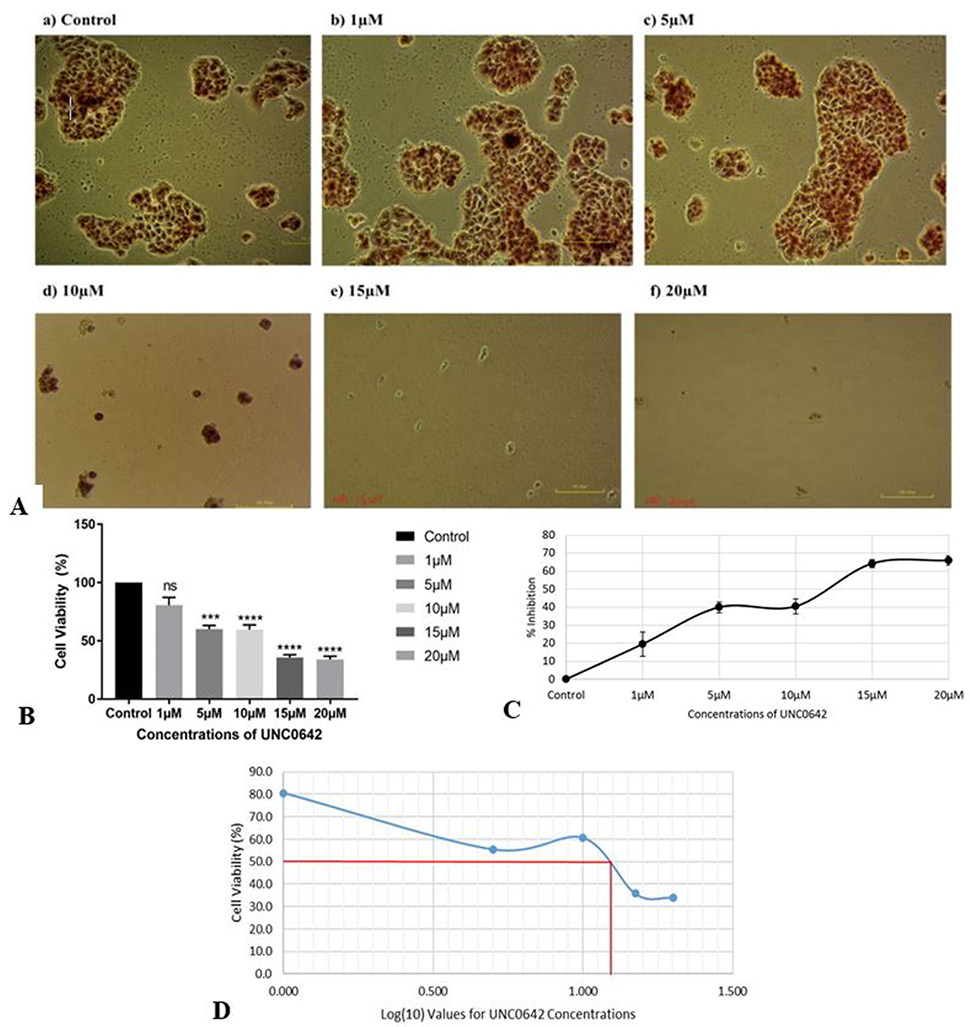
Effect of different concentrations of UNC0642 on the cell viability of MCF-7 cells (A) determined by Neutral Red assay. The control cells were given medium supplemented with 0.05 percent DMSO. (B) shows percentage cell viability. Taking control as 100 percent, the percentage cell viability was computed. GraphPad Prism (version 7) was used for statistical analysis, with one-way ANOVA and Dunnett’s test for multiple comparisons. The data were presented as a mean standard deviation of replicates. (P≥0.05; ns = not significant, *P≤0.05, **P≤0.01, P***≤0.001, ****P≤0.0001). (C) shows the percentage growth inhibition of MCF-7 cells treated with different concentrations of UNC0642. (D) shows logarithmic curve for determination of IC50 of UNC0642 by neutral red assay against the logarithmic values of the concentrations of UNC0642 selected for the present study. Determination of LC50 was done by calculating anti-log value for the value on x-axis (anti-log 1.1) against 50% cell viability (as indicated by red lines).
