Figure 3
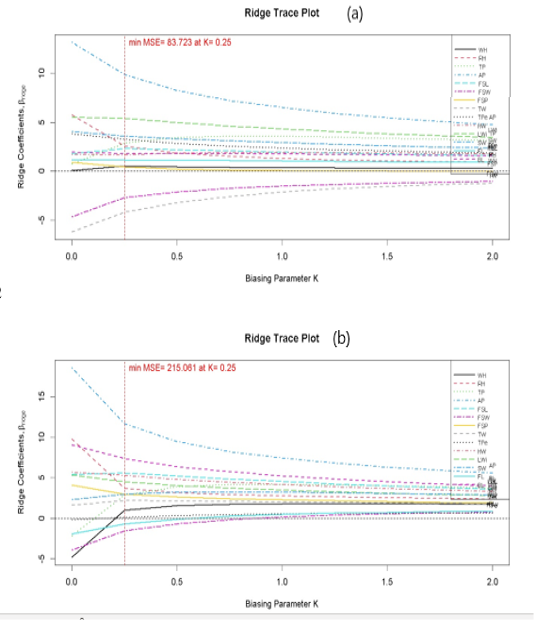
Ridge trace plot of estimated parameters against the k value obtained by Eq. (3) for training data set (a) and testing dataset (b).
Ridge trace plot of estimated parameters against the k value obtained by Eq. (3) for training data set (a) and testing dataset (b).