
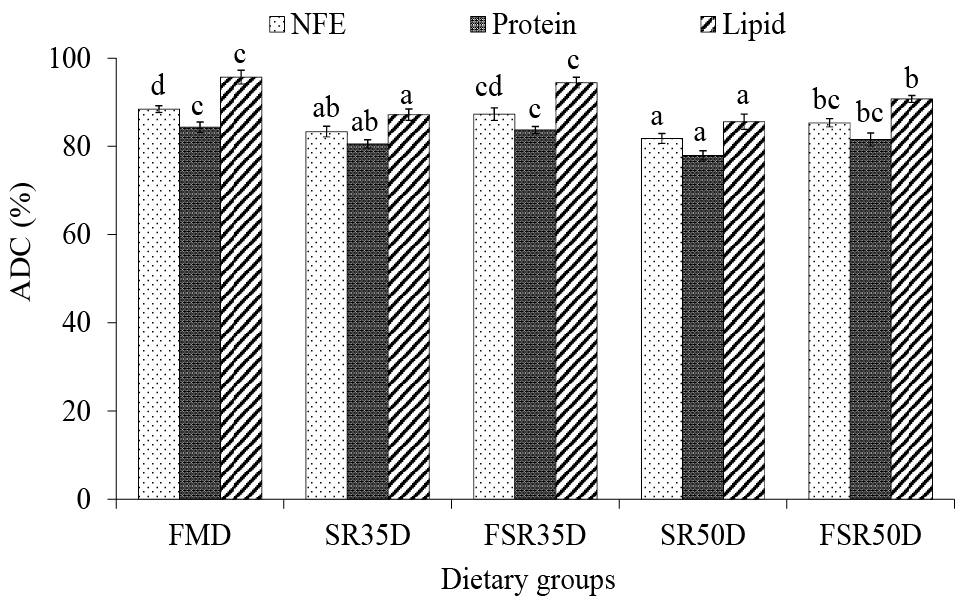
Fig. 3.
Nutrient ADCs of red tilapia fed the experimental diets. Values are presented as means and standard deviations of triplicates. Bars assigned with different letters within each nutrient ADC denote significant differences (P < 0.05).
For details of groups, see Table II.