
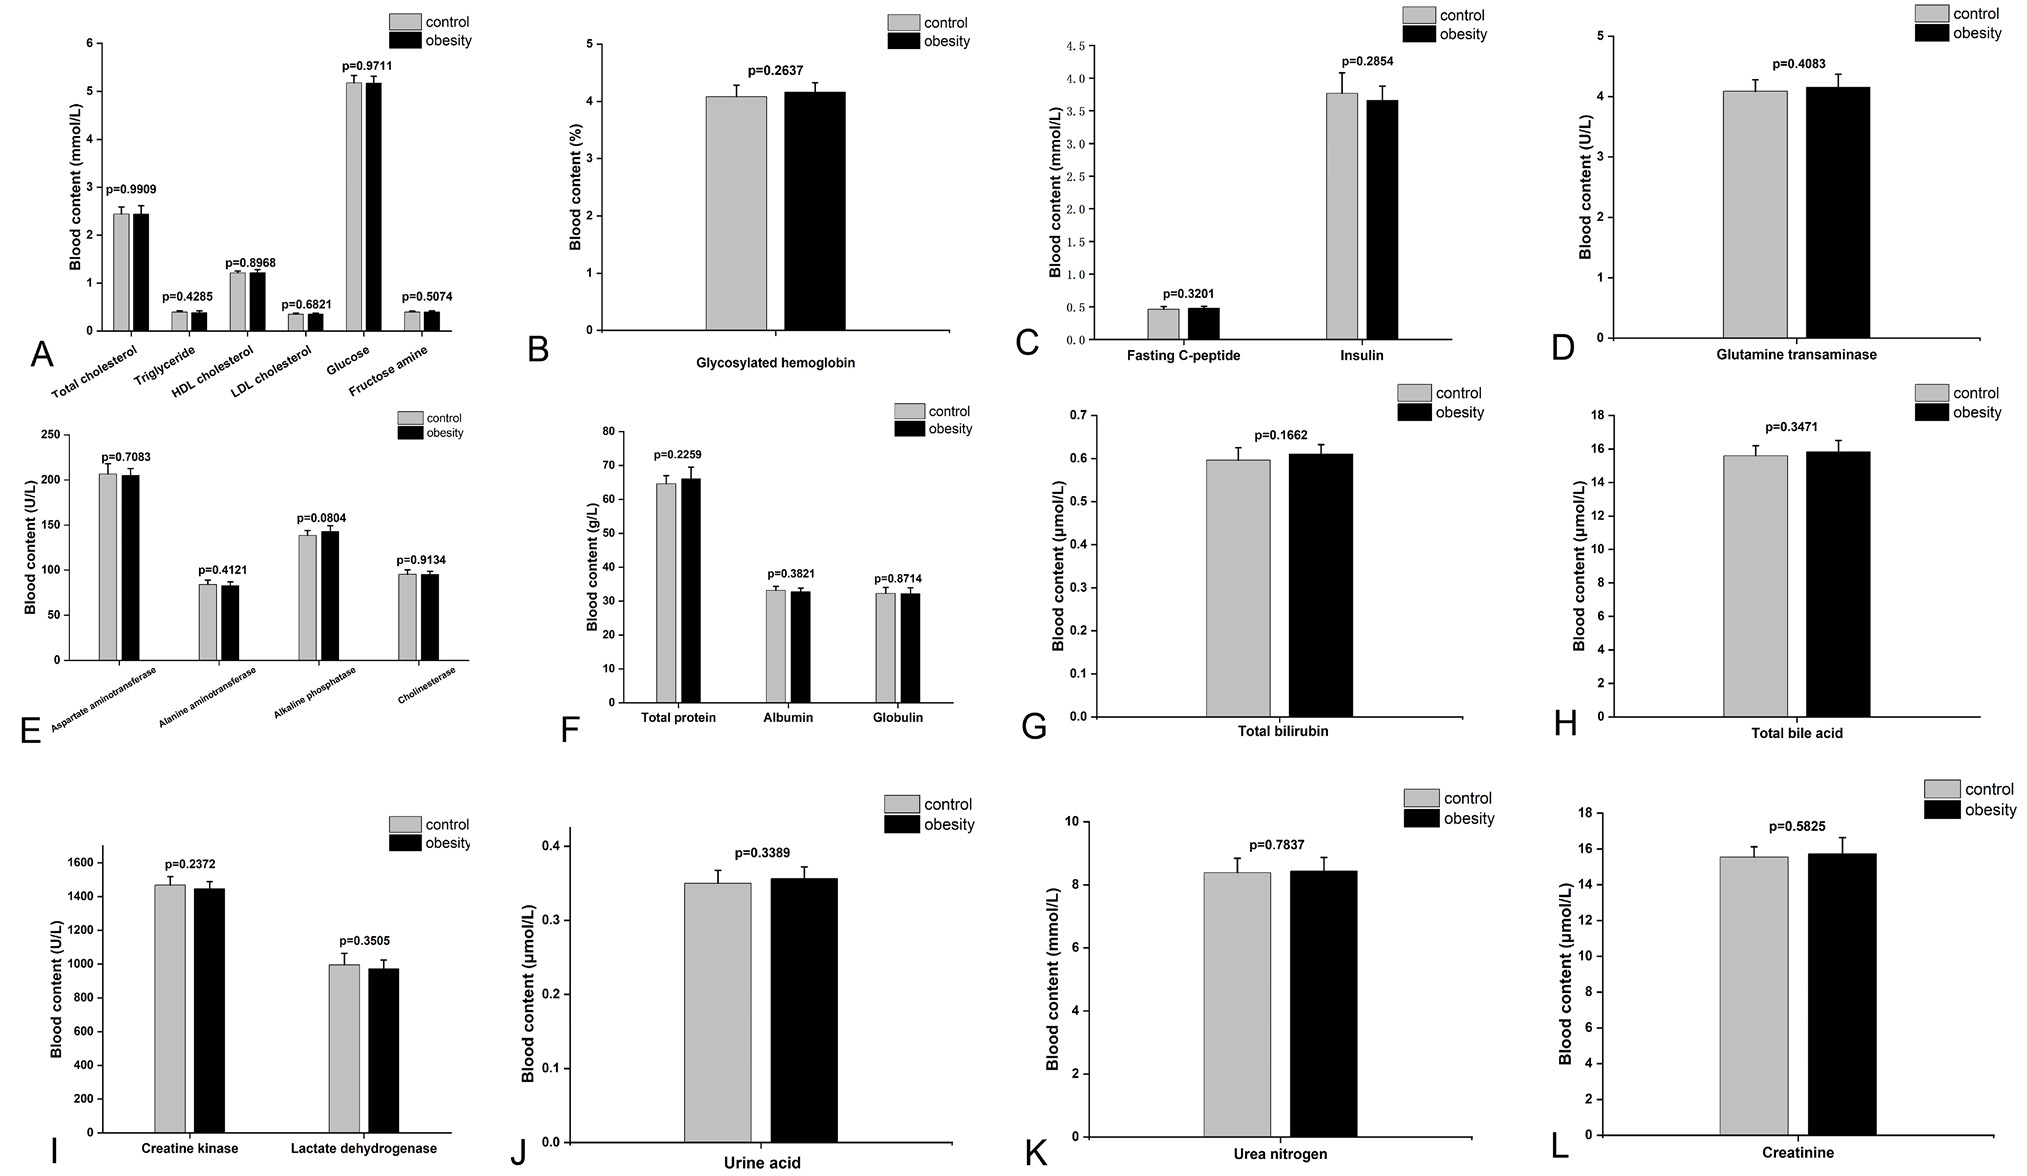
A, Total cholesterol, triglyceride, high density lipoprotein cholesterol, low density lipoprotein cholesterol, glucose, fructose amine levels in blood. B, Glycosylated hemoglobin levels in blood. C, Fasting c-peptide, insulin levels in blood. D, Glutamine transaminase levels in blood. E, Aspartate aminotransferase, alanine aminotransferase, alkaline phosphatase, cholinesterase levels in blood. F, Total protein, albumin, globulin levels in blood. G, Total bilirubin levels in blood. H, Total bile acid levels in blood. I, Creatine kinase, lactate dehydrogenase levels in blood. J, Urine acid levels in blood. K, Urea nitrogen levels in blood. L, Creatinine levels in blood. Data are presented as mean ± SEM; N= 14 per group; statistical significance is indicated: *P < 0.05, ** P < 0.01.