Figure 6:
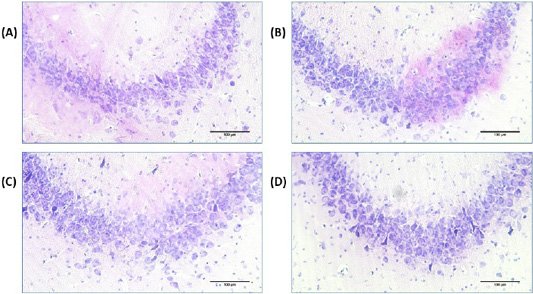
Light micrographs of hippocampus with cresyl violet staining in the control (A), MEL (B), Al (C) and Al+MEL (D) groups in CA3 cell layer of hippocampus in male rats. Bar represents 100μm.
Light micrographs of hippocampus with cresyl violet staining in the control (A), MEL (B), Al (C) and Al+MEL (D) groups in CA3 cell layer of hippocampus in male rats. Bar represents 100μm.