
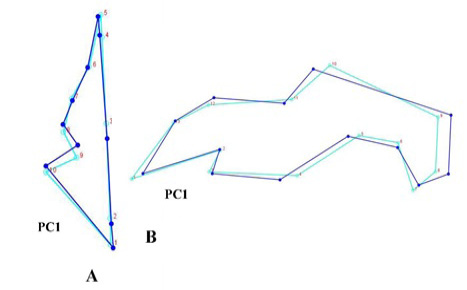
Fig. 5.
Wireframe graphical view of shape differences according to the first principal component A. Dorsal, B. Lateral, dark blue color represents the average shape based on the primary principal component.
Wireframe graphical view of shape differences according to the first principal component A. Dorsal, B. Lateral, dark blue color represents the average shape based on the primary principal component.