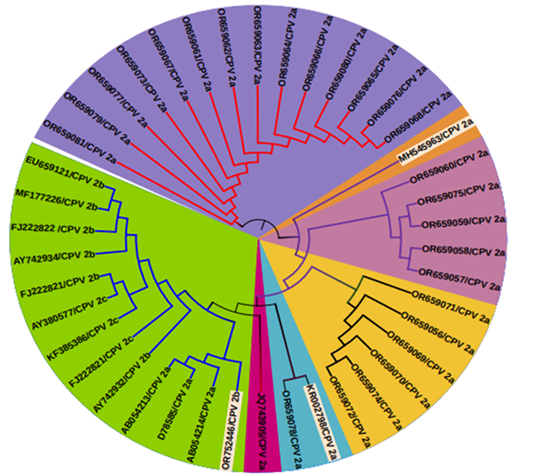
Figure 2:
Maximum neighborhood joining tree depicting the correlation between the partial nucleotide sequences of CPV isolates, which we have collected from various regions of India and analysed from obtained Sanger sequences.
Maximum neighborhood joining tree depicting the correlation between the partial nucleotide sequences of CPV isolates, which we have collected from various regions of India and analysed from obtained Sanger sequences.