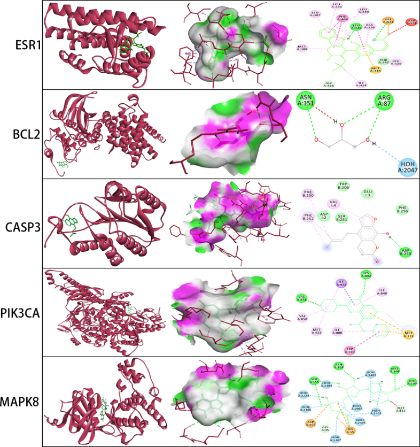
Fig. 5.
Molecular docking visualization results.
Note: From left to right, the above figure is the 3D overall figure of molecular docking, hydrogen bond interaction figure and 2D interaction diagram; in the figure on the left side, red is the target protein structure, and green is the molecular structure of the ingredient; in the figure at the middle position, green is the hydrogen bond donor, and purple is the hydrogen bond acceptor.