View larger version:
Download Original File
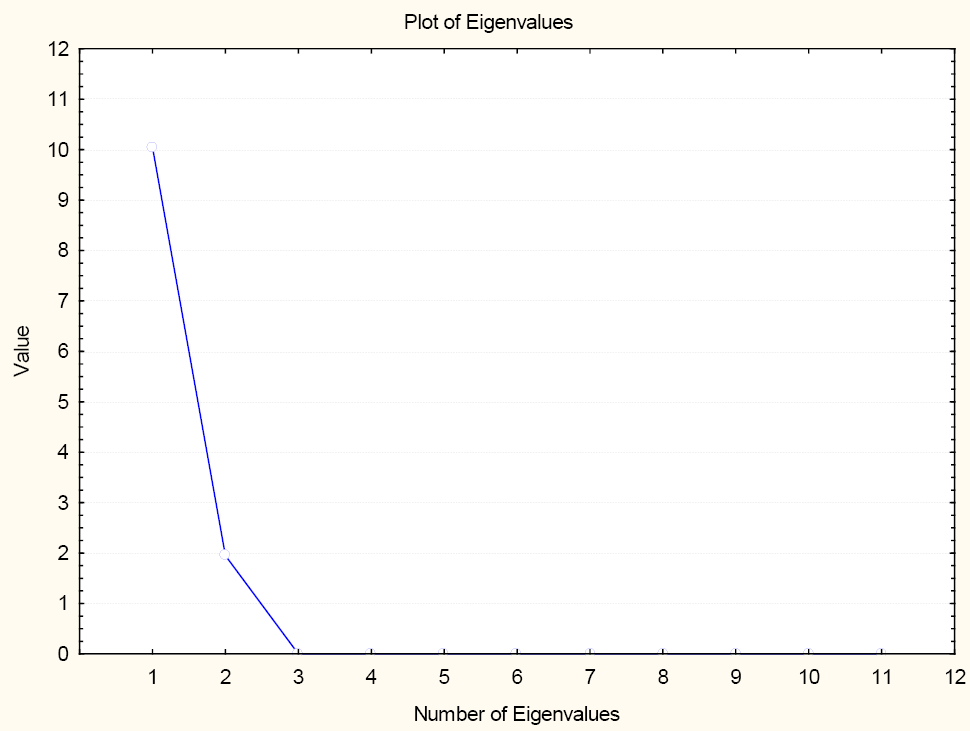
Fig. 3.
Scree plot of the PCA.