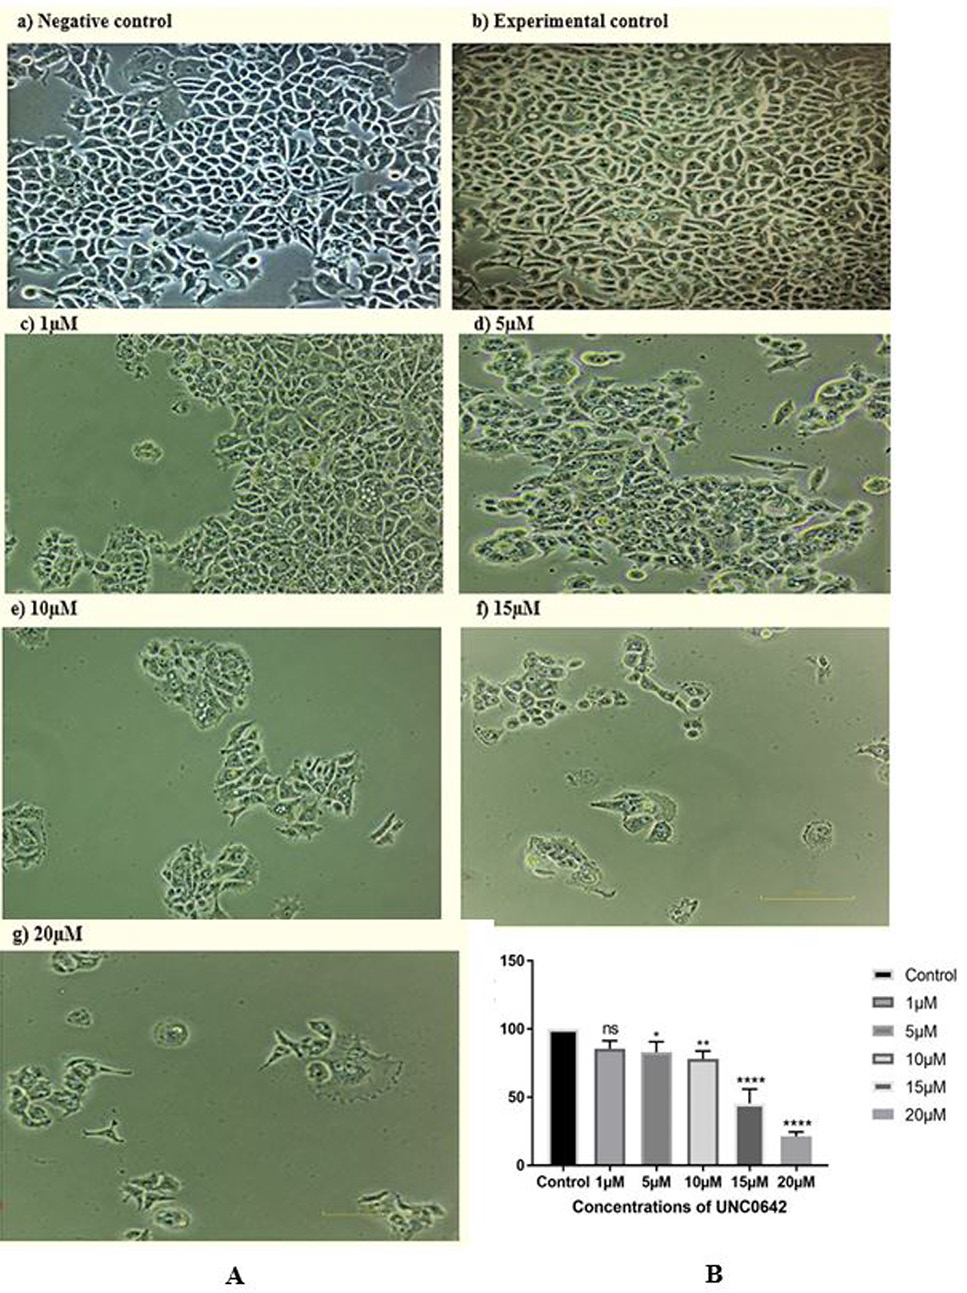
Fig. 3.
Effect of different concentrations of inhibitor UNC0642 administered for 48 h on the morphology of MCF-7 cells (A) (a) Negative control (untreated cells); (b) Experimental control (treated with 0.05% DMSO supplemented medium); (c) 1µM; (d) 5µM; (e) 10µM; (f) 15µM; (g) 20µM after 48 h treatment. The control cells showed normal morphology whereas UNC0642 treated cells exhibited stressed morphology with a significant decrease in the number of cells as the concentration of inhibitor is increased. (B) shows the effect of inhibitor on proliferation of MCF7 cells as determined by BrdU assay. The control cells were treated with 0.05% DMSO supplemented medium. See Figure 2 for statistical detail.