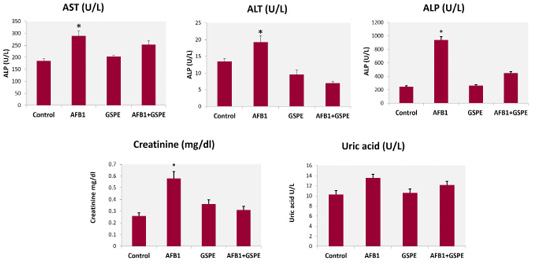
Figure 1:
Effect of GSPE on quails’ liver and kidney functions of fed diets contaminated with AFB1. Values are represented as the mean±SE (n=9). Means within the column with different stars are significantly different, p<0.05
Effect of GSPE on quails’ liver and kidney functions of fed diets contaminated with AFB1. Values are represented as the mean±SE (n=9). Means within the column with different stars are significantly different, p<0.05