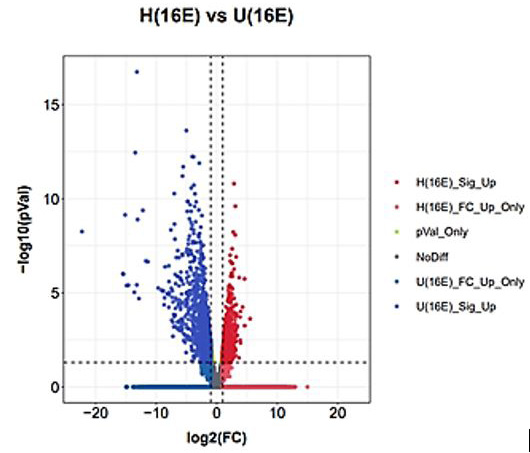
Fig. 2.
The horizontal coordinate, log2(FC), represents the fold change of expression of genes in different samples. The vertical coordinate, -log10(pVal), represents the statistical significance of the difference in gene expression. Genes down-regulated in H(E16) are described as up-regulated in U(E16).